Download presentation
Presentation is loading. Please wait.

1
Center for Structures of Membrane Proteins © 2006 Optimizing x-ray structure determination James Holton LBNL/UCSF April 6, 2006

2
Beamline 8.3.1 staff Acknowledgments George Meigs Jane Tanamachi

3
UCSF UC Berkeley Plexxikon MD Anderson Alberta Synchrotron Institute 8.3.1 PRT Members Funding

4
Optimizing structure determination

5
How many are we solving?

6
Optimizing structure determination How many are we solving? What is the limit?

7
Optimizing structure determination How many are we solving? What is the limit? Are we there yet?

8
Optimizing structure determination How many are we solving? What is the limit? Are we there yet? Why not?

9
Optimizing structure determination How many are we solving? What is the limit? Are we there yet? Why not? What are the biggest problems?

10
Optimizing structure determination How many are we solving? What is the limit? Are we there yet? Why not? What are the biggest problems?

11
How many are we solving?

12
http://asdp.bnl.gov/asda/Libraries/pdb_statis/latest/bml/ALL.html

13
How many are we solving? http://asdp.bnl.gov/asda/Libraries/pdb_statis/latest/bml/ALL.html Jiang & R.M. Sweet (2004)
.")
14
How many are we solving? http://asdp.bnl.gov/asda/Libraries/pdb_statis/latest/bml/ALS.html

15
How many are we solving? http://asdp.bnl.gov/asda/Libraries/pdb_statis/latest/bml/ALS.html

16
How many are we solving? http://asdp.bnl.gov/asda/Libraries/pdb_statis/latest/bml/ALS.html

17
Breaking it down

18
$$ → photons Breaking it down

19
$$ → photons photons → data Breaking it down

20
$$ → photons photons → data data → models Breaking it down

21
$$ → photons photons → data data → models models → results Breaking it down

22
$$ → photons photons → data data → models models → results results → $$ Breaking it down

23
$$ → photons photons → data data → models models → results results → $$ Breaking it down

24
$$ → photons 2x10 11 photons/s ÷ $600,000/year 6x10 12 photons/dollar Breaking it down

25
$$ → photons photons → data data → models models → results results → $$ Breaking it down

26
$$ → photons photons → data data → models models → results results → $$ Breaking it down

27
Operational Efficiency “representative” 8.3.1 user

28
SecondsDescriptionPercent 115200 Assigned to user- Operational Efficiency “representative” 8.3.1 user

29
SecondsDescriptionPercent 115200 Assigned to user- 104490 Light available Operational Efficiency “representative” 8.3.1 user

30
SecondsDescriptionPercent 115200 Assigned to user- 104490 Light available91% Operational Efficiency “representative” 8.3.1 user

31
SecondsDescriptionPercent 104490 Assigned and available91% Operational Efficiency “representative” 8.3.1 user

32
SecondsDescriptionPercent 104490 Assigned and available91% Shutter open Operational Efficiency “representative” 8.3.1 user

33
SecondsDescriptionPercent 104490 Assigned and available91% 42093 Shutter open40% Operational Efficiency “representative” 8.3.1 user

34
SecondsDescriptionPercent 104490 Assigned and available91% 42093 Shutter open40% Collecting (3026 images) Operational Efficiency “representative” 8.3.1 user
 Operational Efficiency representative user")
35
SecondsDescriptionPercent 104490 Assigned and available91% 42093 Shutter open40% 52684 Collecting (3026 images)50% Operational Efficiency “representative” 8.3.1 user
50% Operational Efficiency representative user")
36
SecondsDescriptionPercent 104490 Assigned and available91% 42093 Shutter open40% 52684 Collecting (3026 images)50% Something else Operational Efficiency “representative” 8.3.1 user
50% Something else Operational Efficiency representative user")
37
SecondsDescriptionPercent 104490 Assigned and available91% 42093 Shutter open40% 52684 Collecting (3026 images)50% 51806 Something else50% Operational Efficiency “representative” 8.3.1 user
50% Something else50% Operational Efficiency representative user")
38
SecondsDescriptionPercent 51806 Something else50% Operational Efficiency “representative” 8.3.1 user

39
SecondsDescriptionPercent 51806 Something else100% 45 Mounting Operational Efficiency “representative” 8.3.1 user

40
SecondsDescriptionPercent 51806 Something else100% 247s 45 Mounting22% Operational Efficiency “representative” 8.3.1 user

41
SecondsDescriptionPercent 51806 Something else100% 247s 45 Mounting22% 37 Centering Operational Efficiency “representative” 8.3.1 user

42
SecondsDescriptionPercent 51806 Something else100% 247s 45 Mounting22% 229s 37 Centering16% Operational Efficiency “representative” 8.3.1 user

43
SecondsDescriptionPercent 51806 Something else100% 247s 45 Mounting22% 229s 37 Centering16% 109 Strategizing Operational Efficiency “representative” 8.3.1 user

44
SecondsDescriptionPercent 51806 Something else100% 247s 45 Mounting22% 229s 37 Centering16% 179s 109 Strategizing38% Operational Efficiency “representative” 8.3.1 user

45
SecondsDescriptionPercent 51806 Something else100% 247s 45 Mounting22% 229s 37 Centering16% 179s 109 Strategizing38% 37 Prepping Operational Efficiency “representative” 8.3.1 user

46
SecondsDescriptionPercent 51806 Something else100% 247s 45 Mounting22% 229s 37 Centering16% 179s 109 Strategizing38% 309s 37 Prepping24% Operational Efficiency “representative” 8.3.1 user

47
SecondsDescriptionPercent 51806 Something else32% 10s 45 Mounting1% 30s 37 Centering2% 140s 109 Strategizing29% 0s 37 Prepping0% Operational Efficiency “expert” user

48
SecondsDescriptionPercent 16820 Something else100% 10s 45 Mounting3% 30s 37 Centering7% 140s 109 Strategizing90% 0s 37 Prepping0% Operational Efficiency “expert” user

49
$$ → photons photons → data data → models models → results results → $$ Breaking it down

50
$$ → photons photons → data data → models models → results results → $$ Breaking it down

51
Turning data into models

52
NumberDescriptionPercent Images 8.3.1 in 2003 Turning data into models

53
NumberDescriptionPercent 446028 Images (~7 TB)33% 8.3.1 in 2003 Turning data into models
33% in 2003 Turning data into models")
54
NumberDescriptionPercent 446028 Images (~7 TB)33% Data sets 8.3.1 in 2003 Turning data into models
33% Data sets in 2003 Turning data into models")
55
NumberDescriptionPercent 446028 Images (~7 TB)33% 2346 Data sets47% 8.3.1 in 2003 Turning data into models
33% 2346 Data sets47% in 2003 Turning data into models")
56
NumberDescriptionPercent 446028 Images (~7 TB)33% 2346 Data sets47% MAD/SAD 8.3.1 in 2003 Turning data into models
33% 2346 Data sets47% MAD/SAD in 2003 Turning data into models")
57
NumberDescriptionPercent 446028 Images (~7 TB)33% 2346 Data sets47% 449 MAD/SAD (1:2)19% 8.3.1 in 2003 Turning data into models
33% 2346 Data sets47% 449 MAD/SAD (1:2)19% in 2003 Turning data into models")
58
NumberDescriptionPercent 446028 Images (~7 TB)33% 2346 Data sets47% 449 MAD/SAD (1:2)19% Published 8.3.1 in 2003 Turning data into models
33% 2346 Data sets47% 449 MAD/SAD (1:2)19% Published in 2003 Turning data into models")
59
NumberDescriptionPercent 446028 Images (~7 TB)33% 2346 Data sets47% 449 MAD/SAD (1:2)19% 48 Published2% 8.3.1 in 2003 Turning data into models
33% 2346 Data sets47% 449 MAD/SAD (1:2)19% 48 Published2% in 2003 Turning data into models")
60
Top producing beamlines of the world http://asdp.bnl.gov/asda/Libraries/pdb_statis/latest/bml/ALL.html Structures credited

61
Top producing beamlines of the world http://asdp.bnl.gov/asda/Libraries/pdb_statis/latest/bml/ALL.html x10 6 unique HKLs

62
Top producing beamlines of the world http://asdp.bnl.gov/asda/Libraries/pdb_statis/latest/bml/ALL.html http://biosync.sdsc.edu/ Structures/10 20 photons

63
Optimizing structure determination How many are we solving? What is the limit? Are we there yet? Why not? What are the biggest problems?

64
Optimizing structure determination How many are we solving? What is the limit? Are we there yet? Why not? What are the biggest problems?

65
What is the limit?

66
28 operating US beamlines What is the limit?

67
28 operating US beamlines 2x10 13 ph/s http://biosync.sdsc.edu/ What is the limit?

68
28 operating US beamlines ~10 11 ph/μm 2 exposure limit 2x10 13 ph/s Henderson et al (1990) What is the limit?
 What is the limit")
69
28 operating US beamlines ~10 11 ph/μm 2 exposure limit 2x10 9 ph/μm 2 /s http://biosync.sdsc.edu/ What is the limit?

70
28 operating US beamlines ~10 11 ph/μm 2 exposure limit ÷ 2x10 9 ph/μm 2 /s = 400,000 datasets/year What is the limit?

71
28 operating US beamlines ~10 11 ph/μm 2 exposure limit ÷ 2x10 9 ph/μm 2 /s ~ 200,000 datasets/year What is the limit?

72
28 operating US beamlines ~10 11 ph/μm 2 exposure limit ÷ 2x10 9 ph/μm 2 /s ~ 100,000 datasets/year What is the limit?

73
28 operating US beamlines ~10 11 ph/μm 2 exposure limit ÷ 2x10 9 ph/μm 2 /s ~ 100,000 datasets/year ÷ 1324 str in 2003 Jiang & R.M. Sweet (2004) What is the limit?
 What is the limit .")
74
28 operating US beamlines ~10 11 ph/μm 2 exposure limit ÷ 2x10 9 ph/μm 2 /s ~ 100,000 datasets/year ÷ 1324 str in 2003 ~ 2% efficient What is the limit?

75
NumberDescriptionPercent 446028 Images (~7 TB)33% 2346 Data sets47% 449 MAD/SAD (1:2)19% 48 Published2% 8.3.1 in 2003 Turning data into models
33% 2346 Data sets47% 449 MAD/SAD (1:2)19% 48 Published2% in 2003 Turning data into models")
76
Optimizing structure determination How many are we solving? What is the limit? Are we there yet? Why not? What are the biggest problems?

77
Optimizing structure determination How many are we solving? What is the limit? Are we there yet? Why not? What are the biggest problems?

78
Optimizing structure determination How many are we solving? What is the limit? Are we there yet? Why not? What are the biggest problems?

79
DVD data archive

87
Breaking it down $$ → photons photons → data data → models models → results results → $$

88
Elves examine images and set-up data processing Elves run… mosflm scala solve mlphare dm arp/warp Elven Automation

89
Elves examine images and set-up data processing Elves run… mosflm scala solve mlphare dm arp/warp

90
Elven Automation Elves examine images and set-up data processing Elves run… mosflm scala solve mlphare dm arp/warp

91
How often does it really work? Elven Automation

92
Apr 6 – 24 at ALS 8.3.1 Elven Automation How often does it really work?

93
Apr 6 – 24 at ALS 8.3.1 Elven Automation 27,686images collected

94
Apr 6 – 24 at ALS 8.3.1 Elven Automation 27,686images collected 148datasets (15 MAD)
")
95
Apr 6 – 24 at ALS 8.3.1 Elven Automation 27,686images collected 148datasets (15 MAD) 31investigators
 31investigators")
96
Apr 6 – 24 at ALS 8.3.1 Elven Automation 27,686images collected 148datasets (15 MAD) 31investigators 56unique cells
 31investigators 56unique cells")
97
Apr 6 – 24 at ALS 8.3.1 Elven Automation 27,686images collected 148datasets (15 MAD) 31investigators 56unique cells 5 KDa – 23 MDaasymmetric unit
 31investigators 56unique cells 5 KDa – 23 MDaasymmetric unit")
98
Apr 6 – 24 at ALS 8.3.1 Elven Automation 27,686images collected 148datasets (15 MAD) 31investigators 56unique cells 5 KDa – 23 MDaasymmetric unit 0.94 – 32 Åresolution (3.2 Å)
 31investigators 56unique cells 5 KDa – 23 MDaasymmetric unit 0.94 – 32 Åresolution (3.2 Å)")
99
Apr 6 – 24 at ALS 8.3.1 Elven Automation 148datasets

100
Apr 6 – 24 at ALS 8.3.1 Elven Automation 148datasets 117succeded

101
Apr 6 – 24 at ALS 8.3.1 Elven Automation 148datasets 117succeded ~3.5 (0.1-75)hours
hours")
102
Apr 6 – 24 at ALS 8.3.1 Elven Automation 148datasets 117succeded ~3.5 (0.1-75)hours 31failed
hours 31failed")
103
Apr 6 – 24 at ALS 8.3.1 Elven Automation 148datasets 117succeded ~3.5 (0.1-75)hours 31failed ~61 (0-231)hours
hours 31failed ~61 (0-231)hours")
104
Apr 6 – 24 at ALS 8.3.1 Elven Automation 148datasets 117succeded ~3.5 (0.1-75)hours 31failed ~61 (0-231)hours 2 / 15MAD structures
hours 31failed ~61 (0-231)hours 2 / 15MAD structures")
105
Apr 6 – 24 at ALS 8.3.1 Elven Automation 148datasets 117succeded ~3.5 (0.1-75)hours 31failed ~61 (0-231)hours 2 / 15MAD structures
hours 31failed ~61 (0-231)hours 2 / 15MAD structures")
106
NumberDescriptionPercent 446028 Images (~7 TB)33% 2346 Data sets47% 449 MAD/SAD (1:2)19% 48 Published2% 8.3.1 in 2003 Turning data into models
33% 2346 Data sets47% 449 MAD/SAD (1:2)19% 48 Published2% in 2003 Turning data into models")
107
Optimizing structure determination How many are we solving? What is the limit? Are we there yet? Why not? What are the biggest problems?

108
Optimizing structure determination How many are we solving? What is the limit? Are we there yet? Why not? What are the biggest problems?

109
Why do structures fail?

110
Overlaps Why do structures fail?

111
Overlaps Signal to noise Why do structures fail?

112
Overlaps Signal to noise Radiation Damage Why do structures fail?

113
Overlaps Signal to noise Radiation Damage Why do structures fail?

114
Apr 6 – 24 at ALS 8.3.1 Elven Automation 148datasets 117succeded ~3.5 (0.1-75)hours 31failed ~61 (0-231)hours 2 / 15MAD structures
hours 31failed ~61 (0-231)hours 2 / 15MAD structures")
115
Apr 6 – 24 at ALS 8.3.1 Elven Automation 148datasets 117succeded ~3.5 (0.1-75)hours 31 failed ~61 (0-231)hours 2 / 15MAD structures
hours 31 failed ~61 (0-231)hours 2 / 15MAD structures")
116
unavoidable overlaps

117
detector

118
unavoidable overlaps phi detector

119
unavoidable overlaps mosaicity phi detector

120
unavoidable overlaps mosaicity phi detector c*

121
unavoidable overlaps mosaicity phi detector c* Ewald sphere

122
unavoidable overlaps mosaicity phi detector c* Ewald sphere

123
unavoidable overlaps mosaicity phi detector c* Ewald sphere

124
unavoidable overlaps mosaicity phi detector c* Ewald sphere

125
unavoidable overlaps mosaicity phi detector c* Ewald sphere

126
unavoidable overlaps mosaicity phi detector c* Ewald sphere

127
unavoidable overlaps mosaicity phi detector c* Ewald sphere

128
unavoidable overlaps mosaicity phi detector c* b c a

129
unavoidable overlaps mosaicity phi detector c* b c a

130
unavoidable overlaps mosaicity phi detector c* b c a

131
unavoidable overlaps mosaicity phi detector c* b c a

132
unavoidable overlaps mosaicity phi detector c* b c a Ewald sphere

133
unavoidable overlaps mosaicity phi detector c* b c a Ewald sphere

134
unavoidable overlaps mosaicity phi detector c* b c a Ewald sphere

135
unavoidable overlaps mosaicity phi detector c* b c a Ewald sphere

136
unavoidable overlaps mosaicity phi detector c* b c a Ewald sphere

137
Overlaps Signal to noise Radiation Damage Why do structures fail?

138
Overlaps Signal to noise Radiation Damage Why do structures fail?

139
Apr 6 – 24 at ALS 8.3.1 Elven Automation 148datasets 117succeded ~3.5 (0.1-75)hours 31failed ~61 (0-231)hours 2 / 15MAD structures
hours 31failed ~61 (0-231)hours 2 / 15MAD structures")
140
Apr 6 – 24 at ALS 8.3.1 Elven Automation 148datasets 117succeded ~3.5 (0.1-75)hours 31failed ~61 (0-231)hours 2 / 15MAD structures
hours 31failed ~61 (0-231)hours 2 / 15MAD structures")
141
“What is a good exposure time?”

142
“How much signal do I need?”

143
MAD phasing simulation Anomalous signal to noise ratio Correlation coefficient to correct model mlphare results

144
SAD phasing simulation Anomalous signal to noise ratio Correlation coefficient to correct model mlphare results

145
Minimum required signal (MAD/SAD)
")
146
SAD phasing experiment Anomalous signal to noise ratio Correlation coefficient to published model

147
MR simulation Signal to noise ratio Correlation coefficient to correct density corrupted data

148
MR simulation Signal to noise ratio Correlation coefficient to correct density corrupted data

149
MR simulation Rmsd from perfect search model ( Å ) Correlation coefficient to correct density corrupted model
 Correlation coefficient to correct density corrupted model")
150
MR simulation Fraction of full search model Correlation coefficient to correct density trimmed model

151
Is it real, or is it MLFSOM ?

152
Background scattering Resolution (Ǻ) Electron equivalents The form-factor of the cryostream 20 10 5 4 3 2.5 2 1.8 1.6 1.4 1.2 1 0 2 4 6 8 10 12 14 16 measured theoretical
 Electron equivalents The form-factor of the cryostream measured theoretical")
153
Background scattering Resolution (Ǻ) Photons/s/pixel Se edge with detector at 100 mm 7.5 3.8 2.5 1.9 1.5 1.2 1.1
 Photons/s/pixel Se edge with detector at 100 mm ")
154
“We really need those high-resolution spots”

155
Incremental strategy incremental_strategy.com merged.mtz auto.mat

156
Incremental strategy incremental_strategy.com merged.mtz auto.mat

157
“We have a problem with non-isomorphism”

158
Proteins move

159
Overlaps Signal to noise Radiation Damage Why do structures fail?

160
Overlaps Signal to noise Radiation Damage Why do structures fail?

161
thaw Radiation Damage

162
Distention of cryo with dose

163
before

164
Distention of cryo with dose after

165
Water ring shift saturated sucrose in 250mM WO4 0 MGy

166
Water ring shift saturated sucrose in 250mM WO4 37 MGy

167
Water ring shift saturated sucrose in 250mM WO4 80 MGy

168
Water ring shift saturated sucrose in 250mM WO4 184 MGy

169
Water ring shift Resolution (Ǻ) Photons/s/pixel 7.5 3.8 2.5 1.9 1.5 saturated sucrose in 250mM WO4
 Photons/s/pixel saturated sucrose in 250mM WO4")
170
Water ring shift Resolution (Ǻ) Photons/s/pixel 7.5 3.8 2.5 1.9 1.5 saturated sucrose in 250mM WO4
 Photons/s/pixel saturated sucrose in 250mM WO4")
171
Water ring shift Resolution (Ǻ) Photons/s/pixel 7.5 3.8 2.5 1.9 1.5 saturated sucrose in 250mM WO4
 Photons/s/pixel saturated sucrose in 250mM WO4")
172
Water ring shift Resolution (Ǻ) Photons/s/pixel 7.5 3.8 2.5 1.9 1.5 saturated sucrose in 250mM WO4
 Photons/s/pixel saturated sucrose in 250mM WO4")
173
Water ring shift Resolution (Ǻ) Photons/s/pixel 7.5 3.8 2.5 1.9 1.5 saturated sucrose in 250mM WO4
 Photons/s/pixel saturated sucrose in 250mM WO4")
174
Water ring shift Absorbed dose (MGy) Water ring position (Ǻ) saturated sucrose in 250mM WO4
 Water ring position (Ǻ) saturated sucrose in 250mM WO4")
175
Protein crystal background

177
Water ring shift Absorbed dose (MGy) Water ring position (Ǻ) GCN4-p1-N16A trigonal crystal
 Water ring position (Ǻ) GCN4-p1-N16A trigonal crystal")
178
Water ring shift Absorbed dose (MGy) Water ring position (Ǻ) GCN4-p1-N16A trigonal crystal crystal background saturated sucrose
 Water ring position (Ǻ) GCN4-p1-N16A trigonal crystal crystal background saturated sucrose")
179
Water ring shift http://www.lsbu.ac.uk/water/amorph.html

180
Water ring shift http://www.lsbu.ac.uk/water/amorph.html

181
Water ring shift bubbles? Richard D. Leapman, Songquan Sun, Ultramicroscopy (1995)
")
182
Water ring shift Hydrogen bubbles? Richard D. Leapman, Songquan Sun, Ultramicroscopy (1995)
")
183
Water ring shift Hydrogen bubbles? http://www.rcdc.nd.edu/compilations/Rxn.pdf “The hydrogen atom reacts with organic compounds by abstracting H from saturated molecules and by adding to centers of unsaturation, for example,

184
Water ring shift Hydrogen bubbles? http://www.rcdc.nd.edu/compilations/Rxn.pdf “The hydrogen atom reacts with organic compounds by abstracting H from saturated molecules and by adding to centers of unsaturation, for example,

185
Damage model system

186
67 consecutive data sets

188
Data quality vs exposure Exposure time (min) Correlation coefficient
 Correlation coefficient")
189
Data quality vs exposure Exposure time (min)
 ")
190
Data quality vs exposure Exposure time (min)
 ")
191
Data quality vs exposure Exposure time (min) Resolution limit
 Resolution limit")
192
Data quality vs exposure Exposure time (min) R sym
 R sym")
193
Experimentally-phased map

195
Data quality vs phasing quality Exposure time (min) Correlation coefficient
 Correlation coefficient")
196
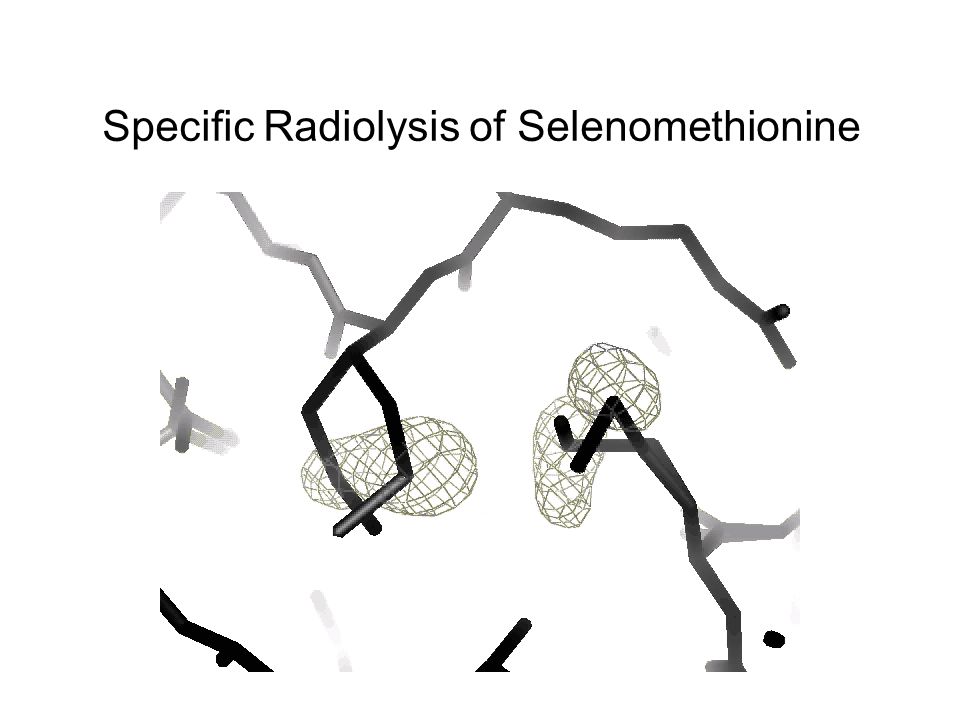
Specific Radiolysis of Selenomethionine

198
67 consecutive data sets

200
Individual atoms decay at different rates Exposure time (min) Correlation coefficient to observed data
 Correlation coefficient to observed data")
201
Damage changes fluorescence spectrum Photon energy (eV) counts
 counts")
202
Damage changes fluorescence spectrum Photon energy (eV) counts
 counts")
203
Damage changes fluorescence spectrum Photon energy (eV) counts
 counts")
204
Damage changes fluorescence spectrum fluence (10 3 photons/mm 2 ) Fraction unconverted 25mM SeMet in 25% glycerol 0.0 0.2 0.4 0.6 0.8 1.0 0 20 40 60 80 100 120 Exposing at 12680 eV
 Fraction unconverted 25mM SeMet in 25% glycerol Exposing at eV")
205
Damage changes fluorescence spectrum fluence (10 3 photons/mm 2 ) Fraction unconverted 25mM SeMet in 25% glycerol 0.0 0.2 0.4 0.6 0.8 1.0 0 20 40 60 80 100 120 Exposing at 12680 eV Se cross-section at 12680 eV
 Fraction unconverted 25mM SeMet in 25% glycerol Exposing at eV Se cross-section at eV")
206
Damage changes fluorescence spectrum Absorbed dose (MGy) Fraction unconverted 25mM SeMet in 25% glycerol 0.0 0.2 0.4 0.6 0.8 1.0 0 10 20 30 40 50 60 Half-dose = 10.6 MGy Exposing at 12680 eV
 Fraction unconverted 25mM SeMet in 25% glycerol Half-dose = 10.6 MGy Exposing at eV")
207
fluorescence probe for damage Absorbed Dose (MGy) Fraction unconverted Wide range of decay rates seen 0.0 0.2 0.4 0.6 0.8 1.0 0 50 100 150 200 Half-dose = 41.7 ± 4 MGy “GCN4” in crystal Half-dose = 5.5 ± 0.6 MGy 8 mM SeMet in NaOH Protection factor: 660% ± 94%
 Fraction unconverted Wide range of decay rates seen Half-dose = 41.7 ± 4 MGy GCN4 in crystal Half-dose = 5.5 ± 0.6 MGy 8 mM SeMet in NaOH Protection factor: 660% ± 94%")
208
“Can we do more with what we’ve got?”

209
SecondsDescriptionPercent 51806 Something else100% 247s 45 Mounting22% 229s 37 Centering16% 179s 109 Strategizing38% 309s 37 Prepping24% Beamline Efficiency “representative” 8.3.1 user

210
SecondsDescriptionPercent 51806 Something else32% 10s 45 Mounting1% 30s 37 Centering2% 140s 109 Strategizing29% 0s 37 Prepping0% Beamline Efficiency “expert” user

211
SecondsDescriptionPercent 16820 Something else100% 10s 45 Mounting3% 30s 37 Centering7% 140s 109 Strategizing90% 0s 37 Prepping0% Beamline Efficiency “expert” user

212
Interleaved Scheduling experiment queuebeamline Minor 30s Choe 120s Alberta 60s Choe 30s Minor 30s

213
cool hand luke

214
Hampton Pin

215
Syrrx Pin

216
plastic Pin

217
Yale Pin

218
what we have here is… failure to communicate

219
SuperPin

220
SuperTong

221
Hampton PinSuper Tong

222
Syrrx PinSuper Tong

223
plastic PinSuper Tong

224
Yale PinSuper Tong

226
“infinite capacity” sample carousel

227
6-foot conveyor

228
Carousel open

229
Carousel cold

230
CHL idlepos

231
Beamline 8.3.1 staff Acknowledgments George Meigs Jane Tanamachi

232
Is it real, or is it MLFSOM ?

233
http://ucxray.berkeley.edu/~jamesh/elves Download Elves from:

Similar presentations


1.6 1.7 4.0 0.020SDCORR1.0 2.2 0.065 36.8PADFPH31.46.>")
 Chap 5 S.M. Sze: Physics of semiconductor devices (Wiley) Chap 13 PHOTODETECTORS Detection.>")