Download presentation
Presentation is loading. Please wait.

1
Block Day- Wednesday, Jan 25 Homework: Final Exam Study Guide Due Friday **LogBook Check on day of semester final **You will not get full credit if you forget it

2
Open to: Grass, Rabbits, and Wolves entry from Tuesday Experiment 1: How does rabbit birth rate affect the size of the rabbit population?

3
2) The birth rate increases but the amount of food And other resources DOES NOT increase Original population graph Time Population Carrying capacity determines the size of the population. If birth rate is increased, the population size will only increase according to the limits of the carrying capacity.

4
Claim: When rabbit birth rate is increased, the size of the population does not increase. Evidence: When the birth rate was 25, the population size was _____ rabbits. When birth rate was 75, the population size was ____ rabbits.

5
Reasoning When birth rate was increased from 25 to 75, there was a change of _____ rabbits for the size of the population. Therefore increasing the birth rate does not increase the size of the population beyond its carrying capacity.

6
How could we increase the rabbit population? http://curriculum.bsd405.org/C6/C17/simulatio ns/default.aspx

7
1) The birth rate DOES NOT change, but the amount of food and other resources increases Time Population Original population graph
 The birth rate DOES NOT change, but the amount of food and other resources increases Time Population Original population graph")
8
Experiment 2: Grass Growth Rate and Wolf Population Size Question: How does grass growth rate affect the size of the wolf population? Hypothesis: Manipulated (Independent) Variable: Responding (Dependent) Variable: Controlled Variables: Grass growth rate Size of wolf population Grass energy, # of rabbits, birth rate, energy from rabbits, wolves ON, # of wolves
 Variable: Responding (Dependent) Variable: Controlled Variables: Grass growth rate Size of wolf population Grass energy, # of rabbits, birth rate, energy from rabbits, wolves ON, # of wolves.")
9
Results:

10
Grass Growth Rate Trial 1Trial 2Trial 3Average 20151816 4026293128 6051463444

11
Conclusion Claim Evidence Reasoning

12
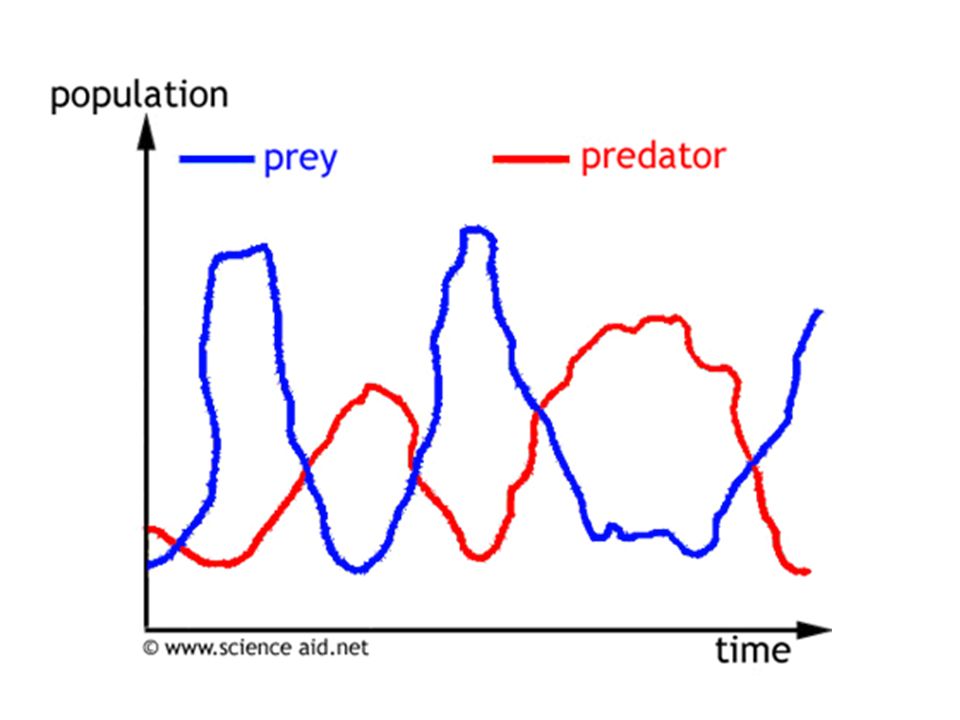
Predator-Prey Relationship Which one is the predator, which one is the prey, Why?

13
1) The predator numbers increase as the prey numbers increase. 2) The predator numbers decline as the prey numbers decline. 3) Why is there a lag time? It takes time for the increase in numbers to occur in response to the increased food. It will take time for the reproduction of the young to occur.
 The predator numbers decline as the prey numbers decline. 3) Why is there a lag time. It takes time for the increase in numbers to occur in response to the increased food. It will take time for the reproduction of the young to occur..")
15
Population Growth Checkup

Similar presentations


(S curve)>")


 Study for Midterm Castle Learning due BEFORE MIDTERM! WEDNESDAY 1/25 8am Extra Help: Friday, Monday,>")
