Download presentation
Presentation is loading. Please wait.

1
Context, Interpretation, Next Steps Linda Greene MS, RN Michael Klompas MD, MPH November 12, 2014 CUSP for Mechanically Ventilated Patients Interim Results

2
Outline CUSP MVP Interim results – Process measures – VAEs How do our VAE results compare with others’ VAE results? Where are the big opportunities for further improvements? The CDC’s Wake Up and Breathe Collaborative Acting on data

3
Let’s Look at the Data

4
Process Measures

5
VAE Rates Rate per 1,000 Vent days

6
Ratio of VACs to IVACs

7
Comparative Data NHSN Comparative data not yet available

8
VAE Rates in Published Studies

9
VAEs by Unit Type Brigham and Women’s Hospital, Boston, MA

10
What percent of VAEs qualify as IVACs?

11
What percent of VAEs qualify as IVACs? Variation by Unit Type Brigham and Women’s Hospital, Boston, MA

12
Where are the major opportunities for improvement?

13
Process Measures

14
The CDC Prevention Epicenters’ Wake Up and Breathe Collaborative

15
Goal: prevent VAEs through less sedation and earlier liberation from mechanical ventilation Mechanism: paired daily spontaneous awakening trials and breathing trials (SATs and SBTs)
")
16
Opt-out protocol for paired daily SATs and SBTs RNs and RTs initiate SATs/SBTs rather than MDs Automatic for all patients unless MD actively “opts out” Protocol developed by national experts Narrow set of well-defined contraindications Multicenter learning collaborative to aid implementation Strategies

17
Collaborative Participants Duke Epicenter Duke MICU Durham VA MICU Duke SICU Durham VA SICU Duke CCU Durham VA CCU Durham Regional Crit Care Chicago Epicenter Stroger ICUW Stroger ICUS Harvard-Irvine Epicenter NSMC Salem NSMC Union Wash U. Epicenter Missouri Baptist Collaborative Participants

18
Collaborative Components All Teach – All Learn Model Each unit designated RN, RT, and MD champions Improvement Advisor to co-ordinate and motivate the collaborative Ronda Sinkowitz-Cochran Two in-person meetings at CDC for all champions Kick-off meeting to orient, educate, and motivate Interim meeting to consolidate and re-motivate Monthly written reports from all ICUs Progress, challenges, successes, and failures Goals for the forthcoming month Monthly collaborative phone calls for all champions Monthly feedback of local and comparative SAT/SBT rates + outcomes Expert advice from CDC and Institute for Healthcare Improvement Collaborative Components

19
Primary Analysis Generalized mixed effects models to evaluate for temporal trends in processes and outcomes at the episode level Assess for linear trend from Nov 2011 to May 2013. Models adjusted for age, sex, SOFA score, reason for intubation, comorbidity score, and unit ID Events per 100 episodes rather than events per 1000 ventilator-days Primary Analysis

20
Study Population Episodes3,425 Vent Days22,991 Age (mean)62.8 Male57% SOFA (mean)9.3 Mean Vent Days6.7 days Mean ICU LOS11.2 days Mean Hospital LOS21.7 days Hospital Mortality28% Study Population
62.8 Male57% SOFA (mean)9.3 Mean Vent Days6.7 days Mean ICU LOS11.2 days Mean Hospital LOS21.7 days Hospital Mortality28% Study Population")
21
Reasons for Intubation

22
VAE Rates Events per 100 Episodes Events per 1000 Vent-Days VAC2938.512.7 IVAC1002.94.3 Possible or Probable Pneumonias 501.52.2 VAE Rates

23
Sample extract from a monthly report

24
Sample unit-specific monthly summary report

25
SAT and SBT rates

26
SAT Performance Rates – Intervention Units SAT Performance Rates

27
SBT Performance Rates – Intervention Units Cumulative Odds Ratio 3.2, 95% CI 2.4-4.1, P<.0001 SBT Performance Rates

28
SBTs done with sedatives off – Intervention Units Cumulative Odds Ratio 107, 95% CI 100-113, P<.0001 SBTs done with sedatives off

29
Outcomes

30
VACs per 100 episodes 37% decrease (RR 0.63, 95% CI 0.42-0.97, P=.04)* * Adjusted for age, sex, SOFA score, reason for intubation, and unit ID VACs per 100 Episodes
* * Adjusted for age, sex, SOFA score, reason for intubation, and unit ID VACs per 100 Episodes")
31
VACs per 1000 ventilator-days No change (RR 1.09, 95% CI 0.72-1.64, P=.73)* * Adjusted for age, sex, SOFA score, reason for intubation, and unit ID VACs per 1000 Vent-Days
* * Adjusted for age, sex, SOFA score, reason for intubation, and unit ID VACs per 1000 Vent-Days")
32
IVACs per 100 episodes 65% decrease (RR 0.35, 95% CI 0.17-0.71, P=.01)* * Adjusted for age, sex, SOFA score, reason for intubation, and unit ID IVACs per 100 Episodes
* * Adjusted for age, sex, SOFA score, reason for intubation, and unit ID IVACs per 100 Episodes")
33
Possible or Probable VAPs per 100 episodes Non-significant decrease (RR 0.51, 95% CI 0.19-1.31, P=.18)* * Adjusted for age, sex, SOFA score, reason for intubation, and unit ID Possible or Probable VAPs per 100 Episodes
* * Adjusted for age, sex, SOFA score, reason for intubation, and unit ID Possible or Probable VAPs per 100 Episodes")
34
Impacts on Other Outcomes Mean vent days: 2.4 days (95% CI, 1.7-3.1) ICU Days: 3.0 days (95% CI, 1.6-4.3) Hospital days: 6.3 days (95% CI, 4.0-8.6) Impacts on Other Outcomes
 ICU Days: 3.0 days (95% CI, ) Hospital days: 6.3 days (95% CI, ) Impacts on Other Outcomes")
35
Self-Extubations per 100 Episodes Significant Increase (OR 2.1, 95% CI 1.1-3.9, P=.03)* * Adjusted for age, sex, SOFA score, reason for intubation, and unit ID Self-extubations per 100 Episodes
* * Adjusted for age, sex, SOFA score, reason for intubation, and unit ID Self-extubations per 100 Episodes")
36
Reintubations per 100 Episodes No Change (OR 1.0, 95% CI 0.66-1.43, P=.86)* * Adjusted for age, sex, SOFA score, reason for intubation, and unit ID Reintubations per 100 Episodes
* * Adjusted for age, sex, SOFA score, reason for intubation, and unit ID Reintubations per 100 Episodes")
37
Key Findings Improving SAT, SBT, and percent of SBTs done off sedation lead to substantial decreases in VACs and IVACs 37% decrease in VACs, 65% decrease in IVACs, 50% (non-significant) decrease in pneumonias Parallel improvements in other important outcomes 2.4 day decrease in mean vent days, 3.0 day decrease in ICU days, 6.3 day decrease in hospital days SAT adherence rates strongly associated with lower VAE rates (VAC, IVAC, and VAP), shorter LOS, and lower mortality. Drop in VACs only when looking at VAC risk per episode, not VAC risk per vent-day Summary of Key Findings

38
Where to Start ? 1.Look at both process and outcome measures 2.Do we see improvements? 3.Important to track your own performance over time Acting on Data

39
Overall Performance REVIEW OF DATA Collaborative is making progress Early evidence of improvement Process Measures VAE Rates Collaborative Participants

40
Proportions consistent with early NHSN data. Improvement over time: process and outcome measures improve consistently Compare your data with peer group Importance to hardwire processes NHSN comparative data coming soonAnalysis

41
Data Sharing and Feedback At the bedside In Meetings Use your data to drive improvement

42
Thank You!

43
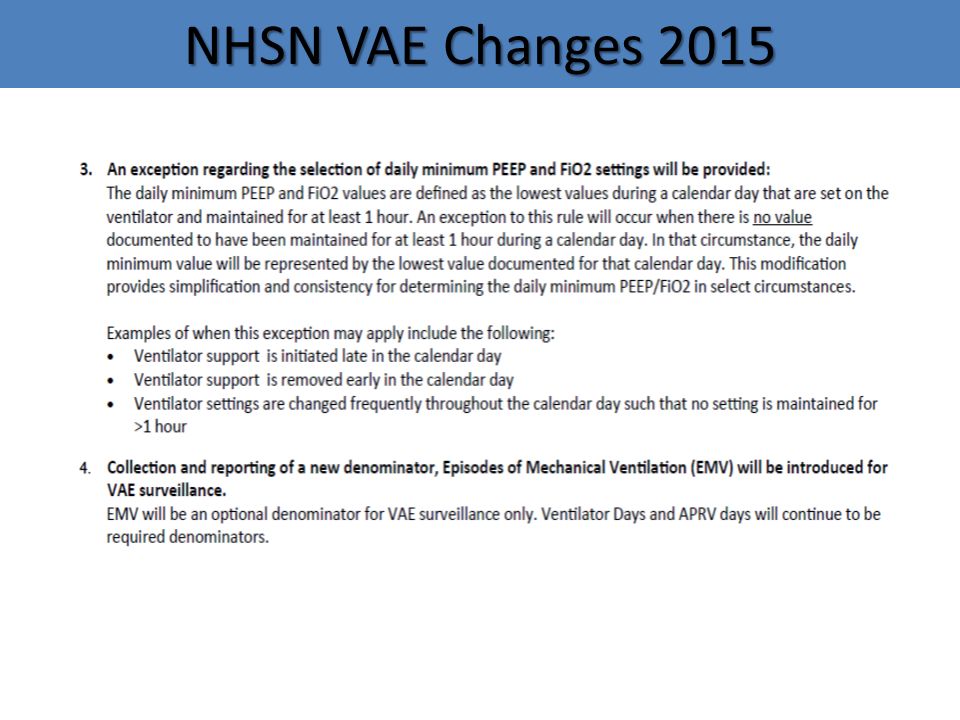
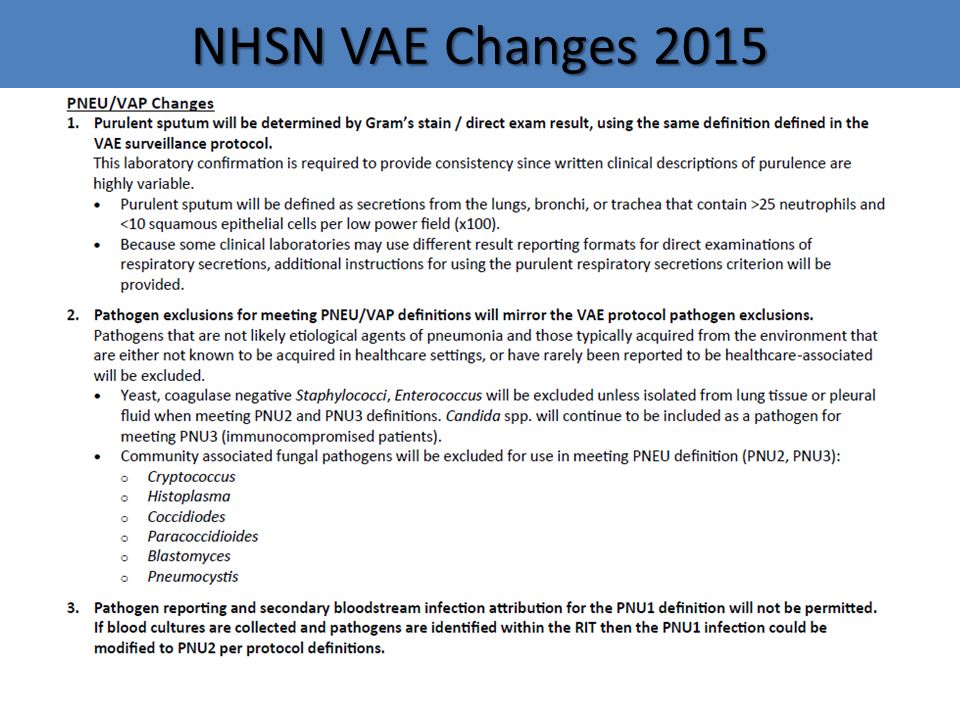
NHSN VAE Changes 2015

46
Timing of VAE Onset Magill, IDWeek 2014, Abstract 1234

Similar presentations


. Through these.>")
>")


 MS, CIC Infection Control Practitioner.>")
 Benchmarking Critical Care Outcomes: Using data to drive effectiveness and efficiency Thomas L. Higgins MD MBA Vice Chair for Clinical.>")
: Does your audience prefer words, colors, and/or δymβφĨs? Dana Burshell, MPH, CPH, CIC HAI.>")


