Download presentation
Presentation is loading. Please wait.

1
Psychology The Study of Human Behavior

2
Purpose of Psychology -To describe behavior - To predict behavior - To change behavior

3
Common sense says… Opposites Attract Birds of a Feather Stick Together Out of Sight Out of Mind Absence Makes the Heart Grow Fonder

4
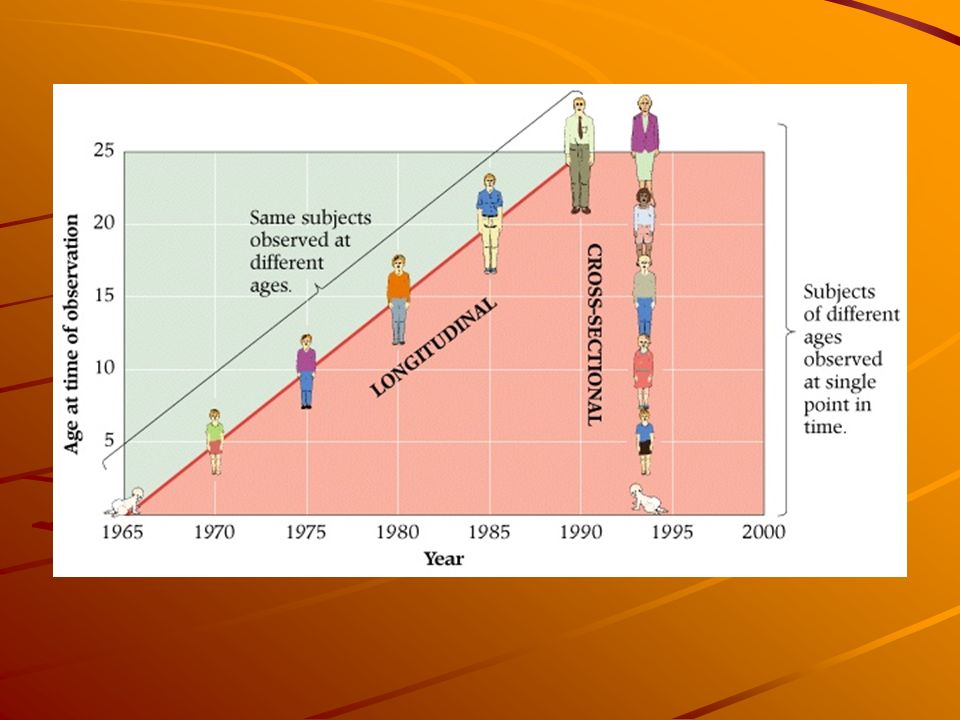
Ways to Study Behavior ObserveTest Ask NaturalisticExperimental method longitudinal Case study survey Cross section

6
How to universalize Who does it apply to…. SampleRandom selection assignment Population (Stratified) Cause - Effect Operational Definition; to operationalize Dependent VariableIndependent Variable Controlled Variables Between Group Design vs. With-in Group Design
 Cause - Effect Operational Definition; to operationalize Dependent VariableIndependent Variable Controlled Variables Between Group Design vs. With-in Group Design.")
7
Operationalize 8 A psychologist wants to know if counseling will make people less depressed 2 How do different types of jokes affect a person’s sense of humor. 3 Overall senior girls are prettier than junior girls but the juniors are less insane 4 People who make over $300,000 a year tend to be snobs 5 School spirit is at an all time low 6 The Rolling Stones are the best rock group ever. 7 College athletes are not as smart as regular students 1 People dream more If they have eaten a big meal 3 hours before sleep Billy is on a new behavior program, will it make him act more friendly toward others

8
Hypothesis Utilize the following format If-----(IV) Then -----(DV)
 Then -----(DV)")
9
Errors Every (experiment) Study (Subject Selection) Can (Control/Confounding) Be (Bias) Pretty (Practice Effect) Dirty (Demand Effect)
 Study (Subject Selection) Can (Control/Confounding) Be (Bias) Pretty (Practice Effect) Dirty (Demand Effect)")
10
Experiment Design Most general of the errors. There are many, many ways to botch the design of an experiment.

11
Subject Selection Selection must be random Assignment must be random If subject reflect the population

12
Confounding Variables Other variables -that could cause the behavior -stuff not accounted for

13
Control Errors Things not kept the same for all subjects

14
Bias Experimenter Bias Researcher influences results E.g. –The experimenter mood, –facial expression –actions

15
Practice Effect Your subjects get better as they do it longer. E.g. - Most tests of manual dexterity –Color discrimination

16
Demand Effect Subjects intentionally do act the way the experimenter expects them to. Examples: –The good subject – The subject tries to “help” the experimenter by doing whatever it takes to confirm the hypothesis –The negative subject – The subject tries to destroy the credibility of the study.

17
Ethics Consent Protection Confidentiality Debriefing Animal Studies

18
Types of Statistics in Psychology Descriptive Statistics: Describe data to get meaning Inferential Statistics: Use data for drawing conclusions

19
Descriptive Statistics Central Tendency Measures of Variability Standard Scores Bell Curve

20
Measures of Central Tendency A number describing a typical score around which the other scores fall Mean = average Median= score that in the middle; half the values fall and half below Mode = most frequently occurring score

21
Measures of Variability Provide a single number that tell us how spread out the scores are Range = Difference between the highest and lowest scores Standard Deviation = how much a typical score differs from the mean of a group of scores Z Score: how many standard deviations above or below the mean

22
Bell Curve Normal Curve: Bell-shaped curve, most scores in the middle and very few extremely high and low scores Mean, Median & Mode all equal When it isn’t – skewed right or left

23
Fig. A.3 The normal curve. The normal curve is an idealized mathematical model. However, many measurements in psychology closely approximate a normal curve. The scales you see here show the relationship of standard deviations, z-scores, and other measures to the curve.

24
Fig. A.4 Relationship between the standard deviation and the normal curve.

25
Inferential Statistics Statistical Significance: Degree to which an event is unlikely to have occurred by chance alone p<_.05

26
Drivers 2nd 8 7 6 5 4 3 2 1 090120150180210240270300330360

27
Drivers 3rd 8 7 6 5 4 3 2 1 090120150180210240270300330360

28
Drivers 4th 8 7 6 5 4 3 2 1 090120150180210240270300330360

29
Drivers 5th 8 7 6 5 4 3 2 1 090120150180210240270300330360

30
Correlation Shows a relationship between 2 variables Corelation Co-efficient between -1 and 1 (slope)
")
31
Bell Curve

32
Study Chart

33
Correlation

34
Professor Perry is interested in testing whether the amount of time a person spends with children affects his attitudes toward having children of his/her own. She randomly chooses a sample and randomly assigns them to two groups. Group 1 spends 5 hours a day for a week with a group of children. Group 2 spends 1 hour a day for a week with the same group of children. At the end of the week, Professor Perry measures their attitudes with a survey.

Similar presentations
 Chapter 1 Thinking Critically with Psychological Science James A. McCubbin, PhD Clemson University Worth Publishers.>")


 David Myers PowerPoint Slides Aneeq Ahmad Henderson State University Worth Publishers, © 2008.>")


