Download presentation
Presentation is loading. Please wait.

1
2015 English Indices of Deprivation – Torbay Contact: statistics@torbay.gov.uk Torbay Public Health

2
Overview Background How is the model built? Local Authority level deprivation Neighbourhood level deprivation Change overtime

3
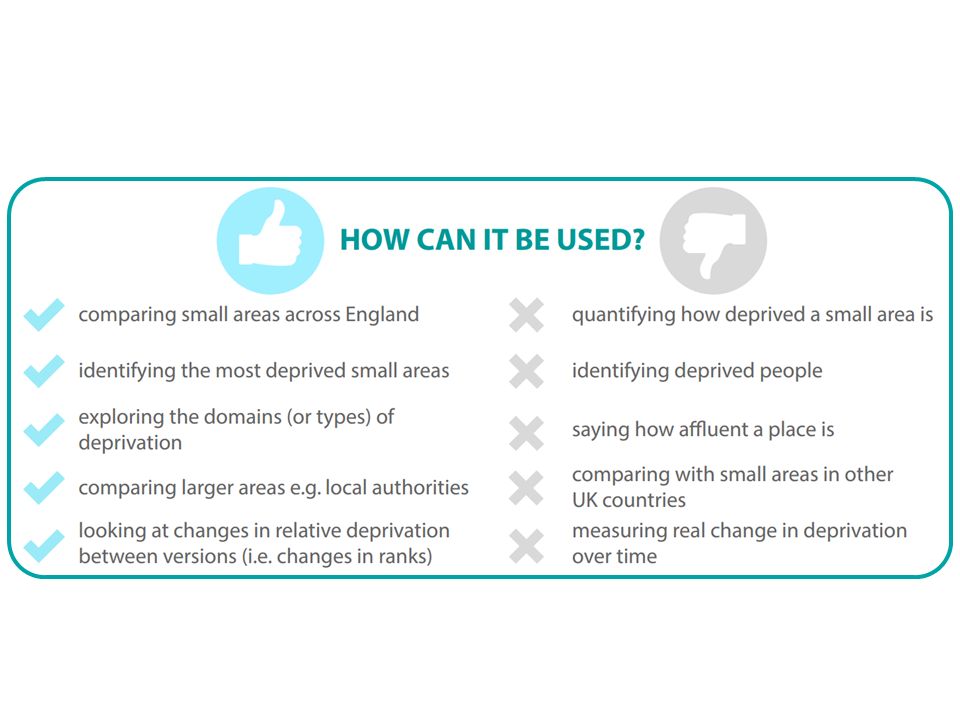
Background It’s the governments official measure of multiple deprivation The Indices of Deprivation 2015 provide a set of relative measures of deprivation for small areas (Lower-layer Super Output Areas) across England, based on seven different domains The 2015 indices are the 4 th release at small area A range of summary measures are available for higher- level geographies including local authorities, local enterprise partnerships, and clinical commissioning groups
 across England, based on seven different domains The 2015 indices are the 4 th release at small area A range of summary measures are available for higher- level geographies including local authorities, local enterprise partnerships, and clinical commissioning groups")
4
How is the model built? The Index of Multiple Deprivation (IMD) is a weighted model across 7 domains Income and Employment contribute almost half (45%) of the overall model
 is a weighted model across 7 domains Income and Employment contribute almost half (45%) of the overall model.")
5
There are 37 indicators that are used within overall IMD and the domains Most of the data is taken from 2012/13

7
SUMMARIES TWO LEVELS Neighbourhood level (LSOA) Local authority level The deprivation indices are published at two levels; the authority level is presented first, followed by the neighbourhood…
 Local authority level The deprivation indices are published at two levels; the authority level is presented first, followed by the neighbourhood…")
8
How does Torbay Compare? Torbay ranked as: – 46 of 326 districts – 37 of 152 upper tier Nearest Unitary neighbours (district LA rank of 326) IMD rank of average rank 20102015 Blackpool104 Torbay4946 North East Lincolnshire7865 Redcar and Cleveland7178 Plymouth8082 Isle of Wight10683 Southend-on-Sea117105 Bournemouth96117 Darlington104122 Herefordshire, County of145126 Northumberland144145 Shropshire166175 Poole187208 East Riding of Yorkshire216215 North Somerset224 Bath and North East Somerset254268 2015 CIPFA LA nearest neighbours
 IMD rank of average rank Blackpool104 Torbay4946 North East Lincolnshire7865 Redcar and Cleveland7178 Plymouth8082 Isle of Wight10683 Southend-on-Sea Bournemouth96117 Darlington Herefordshire, County of Northumberland Shropshire Poole East Riding of Yorkshire North Somerset224 Bath and North East Somerset CIPFA LA nearest neighbours.")
9
Relative District Position (new measures for 2015) Interpreting the dials: The dial represents the 326 district LAs in England. The dial segments represent district LAs by decile. E.g. the red segments show the LAs that rank amongst the 10% most deprived in England. The orange pin marks Torbay LAs position. The grey pin marks Plymouth LAs position (nearest unitary authority statistical neighbour).
..")
10
Relative District Position

11
Change over time - Torbay Interpreting the chart: The darker circles represent the latest data; the lighter previous releases The numbers at the bottom of the chart represent Torbay’s ranking (position) over time The circles presented in the chart represent Torbay’s relative position against all district authority areas in England District level measure provides comparable measure overtime
 over time The circles presented in the chart represent Torbay’s relative position against all district authority areas in England District level measure provides comparable measure overtime")
12
Neighbourhood level - Torbay IMD Release Resident population in top 20% most deprived 200418,150 200721,800 201024,700 201542,000

13
Areas in top 20% 28 (16) LSOAs 42,000 (32%) Average age Torbay = 42.5 years England = 35.5 years Lowest rank 219 (Roundham) 6 areas in top 1,000 Index of Multiple Deprivation
 LSOAs 42,000 (32%) Average age Torbay = 42.5 years England = 35.5 years Lowest rank 219 (Roundham) 6 areas in top 1,000 Index of Multiple Deprivation")
14
Income Deprivation Areas in top 20% 28 (19) LSOAs 41,900 (32%) Average age Torbay = 41.3 years England = 35.5 years Lowest rank 708 (Roundham) 2 areas in top 1,000
 LSOAs 41,900 (32%) Average age Torbay = 41.3 years England = 35.5 years Lowest rank 708 (Roundham) 2 areas in top 1,000")
15
Employment Deprivation Areas in top 20% 35 (33) LSOAs 52,300 (40%) Average age Torbay = 42.9 years England = 36.5 years Lowest rank 233 (Roundham) 8 areas in top 1,000
 LSOAs 52,300 (40%) Average age Torbay = 42.9 years England = 36.5 years Lowest rank 233 (Roundham) 8 areas in top 1,000")
16
Proportion of resident population aged 16-64 claiming Jobseeker's Allowance Source: NOMIS Aug 2015 - highest in Region Absolute v relative change There have been absolute improvements in some data, however faster and larger improvements have taken place elsewhere; e.g. Child poverty – absolute improvement, but relatively high levels remain Annual gross pay – absolute improvement, but relatively low compared to other areas

17
Education, Skills and Training Deprivation Areas in top 20% 15 (11) LSOAs Resident 21,900 (17%) Average age Torbay = 40.2 years England = 36.3 years Lowest rank 854 (Watcombe) 1 area in top 1,000
 LSOAs Resident 21,900 (17%) Average age Torbay = 40.2 years England = 36.3 years Lowest rank 854 (Watcombe) 1 area in top 1,000")
18
Health Deprivation and Disability Areas in top 20% 33 (14) LSOAs 49,200 (37%) Average age Torbay = 42.7 years England = 36.8 years Lowest rank 613 (Tormohun) 3 areas in top 1,000
 LSOAs 49,200 (37%) Average age Torbay = 42.7 years England = 36.8 years Lowest rank 613 (Tormohun) 3 areas in top 1,000")
19
Crime Deprivation Areas in top 20% 23 (17) LSOAs 34,600 (26%) Average age Torbay = 42.1 years England = 35.6 years Lowest rank 19 (Wellswood) 7 areas in top 1,000
 LSOAs 34,600 (26%) Average age Torbay = 42.1 years England = 35.6 years Lowest rank 19 (Wellswood) 7 areas in top 1,000")
20
Barriers to Housing and Services Deprivation Areas in top 20% 1 (7) LSOAs 1,700 (1%) Average age Torbay = 42.2 years England = 37.8 years Lowest rank 3,591 (Blatchcombe) 0 areas in top 1,000
 LSOAs 1,700 (1%) Average age Torbay = 42.2 years England = 37.8 years Lowest rank 3,591 (Blatchcombe) 0 areas in top 1,000")
21
Living Environment Deprivation Areas in top 20% 26 (32) LSOAs 38,700 (29%) Average age Torbay = 43.8 years England = 36.8 years Lowest rank 223 (Ellacombe) 10 areas in top 1,000
 LSOAs 38,700 (29%) Average age Torbay = 43.8 years England = 36.8 years Lowest rank 223 (Ellacombe) 10 areas in top 1,000")
22
Areas in top 20% 22 (15) LSOAs 32,400 (25%) Average age Torbay = 40.8 years England = 35.2 years Lowest rank 1,076 (Watcombe) 0 areas in top 1,000 Income Deprivation Affecting Children
 LSOAs 32,400 (25%) Average age Torbay = 40.8 years England = 35.2 years Lowest rank 1,076 (Watcombe) 0 areas in top 1,000 Income Deprivation Affecting Children")
23
Areas in top 20% 19 (16) LSOAs 28,000 (21%) Average age Torbay = 40.1 years England = 34.6 years Lowest rank 1,128 (Watcombe) 0 areas in top 1,000 Income Deprivation Affecting Older People
 LSOAs 28,000 (21%) Average age Torbay = 40.1 years England = 34.6 years Lowest rank 1,128 (Watcombe) 0 areas in top 1,000 Income Deprivation Affecting Older People")
24
Change in count of Torbay LSOAs in top 20% most deprived Interpreting the chart: The darker circles represent the latest data; the lighter previous releases The numbers at the bottom of the chart represent the count of areas in the top 20% most deprived in Torbay over time The red circles indicate what is driving the increase in multiple deprivation

25
Widening inequalities in Torbay 2 communities that were ranked as in the 10+% to 20% most deprived in 2010 are now ranked in the top 10% most deprived in 2015 – these changes are shown in red ‘The poor are getting poorer’ A communities that was ranked as in the 40+% to 50% most deprived in 2010 are now ranked in the 50+% to 60% most deprived in 2015 – these changes are shown in green ‘The rich are getting richer’

26
Main Messages Torbay’s overall position, relative to other local authorities, has worsened slightly Torbay is identified as the most deprived district local authority area in the South West region Increasing population living in top 20% most deprived There has been a widening gap in relative levels of deprivation across the communities of Torbay

Similar presentations


 Officer 14 October 2014.>")


 2009 Inverclyde Council Niamh Laffan Office of the Chief Statistician Scottish Government.>")


