Download presentation
Presentation is loading. Please wait.

1
1 PROVINCIAL AIDS COUNCIL 10 AUG 2011 OUTCOME 2: A LONG AND HEALTHY LIFE FOR ALL SOUTH AFRICANS

3
Estimated number of annual new HIV infections in South Africans aged 15-49, by province (2009, EPP estimates) Source: 2009 EPP estimates provided by E. Gouws in 2010

4
KZN KNOW YOUR EPIDEMIC KNOW YOUR RESPONSE REPORT The following areas are important for the appropriate response in KZN. Sexual Partners Marital status, Race, Gender, Location, Education and sexual behaviour To be noted in Africa Centre Research it was found: Females, the most significant factor protecting against first sex before 17 was school attendance

5
SEXUAL PARTNERS: Percent of people reporting 2+ partners for the past month among those who had sex in the past year, KwaZulu-Natal (NCS 2006 and 2009) Source: HDA secondary analysis NCS 2006 and 2009. Note: All sample sizes above 260, apart from the Non-African stratum of 2009 (N= 53)
.")
6
Marital Status & HIV Prevalence Source: HDA secondary analysis NCS 2006 and 2009.

7
200220052008 HIV prevalence (95%CI) African Non-African 17.1 0.6 22.7 1.8 26.2 0.2 Male Female 10.6 17.4 14.7 21.8 16.5 23.6 Urban formal Urban informal Rural formal Rural informal 13.6 24.5 15.8 12.2 16.4 24.3 27.7 18.7 14.4 33.8 29.8 22.1 No education Primary Secondary High school Tertiary 14.7 17.4 12.5 14.0 14.8 12.1 18.9 20.5 23.0 10.5 14.5 22.6 24.2 18.0 11.6 Never married, never sex Never married, had sex Married Widowed/divorced 0.0 9.5 7.9 29.9 5.3 29.7 12.7 11.9 5.8 31.8 10.2 7.6 Virgin Secondary abstinence Sexually active 6.3 11.6 18.7 5.0 13.7 24.7 5.2 15.9 23.8 HIV prevalence in adults aged 15+ years in KwaZulu-Natal (2002, 2005, 2008) Source: HSRC secondary data analysis
 African Non-African Male Female Urban formal Urban informal Rural formal Rural informal No education Primary Secondary High school Tertiary Never married, never sex Never married, had sex Married Widowed/divorced Virgin Secondary abstinence Sexually active HIV prevalence in adults aged 15+ years in KwaZulu-Natal (2002, 2005, 2008) Source: HSRC secondary data analysis")
8
Knowledge in KZN Knowledge on HIV transmission and prevention: The last two HSRC surveys (2005 & 2008) compared the prevalence of ‘ correct knowledge on prevention and the rejection of misconceptions ’. In KZN, just like in Eastern Cape, Limpopo and Mpumalanga, there was a significant decrease noted - the KZN prevalence levels were 49% in 2005 and 30% in 2008.

9
Gender and HIV in KZN Females: unprotected sex was associated with: unemployment, lower perceived power negative condom attitudes, weaker condom use norms & intentions, lower behavioural skills, lower HIV stigma, being threatened with physical violence, and experiencing physical violence.

10
Gender and HIV KZN Males: unprotected sex was associated with lower education, lower HIV-related knowledge, negative condom attitudes, alcohol before sex, recent clinical STI treatment, and having a partner who was trying to conceive.

11
Prevalence of Rape as reported by men IMAGE STUDY QOUTED IN KYE KYR REPORT

12
KZNNational Youth 16-246.%2.7% Adults 25-554.5%3.4% Females:6.4%2.1% Males4.0%4.1% Economic Status and HIV The NCS 2009 reported the following percentages of people saying that they provided sex in exchange for money or gifts in the past year in KZN (national average):
:")
13
Migration and HIV Barnighausen et al. (2007) found that migration was significantly associated with HIV incidence Also from KZN, Camlin (2008) reported that women ’ s involvement in migration exacerbates their disproportionate infection risk relative to men.
 found that migration was significantly associated with HIV incidence Also from KZN, Camlin (2008) reported that women ’ s involvement in migration exacerbates their disproportionate infection risk relative to men..")
14
Orphans and Vulnerable Children in KZN ( using ASSA Model 2008 for AIDS and Demographics) Paternal Orphans 200920102011 Total 867116873879873578 Maternal Orphans 200920102011 Total 472462.486793.495544. New 5499452096.50643. AIDS 364279.383803.397714.

15
200920102011 Total 188119202244212687 New 330293150130602 Double Orphans Orphans and Vulnerable Children in KZN ( using ASSA Model 2008 for AIDS and Demographics

16
THE KZN RESPONSE

17
PREVENTION: HCT HCT target according to NSP was 3 059 233 (49% of targeted population). 2 929 433 (95%) client tested, 561 057 (19%) clients tested positive. Improvement of 225% testing from 2009/10 data 2 305 000 clients screened for TB and 356 761 were referred for clinical diagnosis The campaign improved the PICT implementation Campaign continues with new target of 2 061 196
 client tested, (19%) clients tested positive. Improvement of 225% testing from 2009/10 data clients screened for TB and were referred for clinical diagnosis The campaign improved the PICT implementation Campaign continues with new target of")
18
HCT Progress DISTRICTSPre testTotal Tested Testing rate (%) Campaign TargetTarget Achieved PositivePositivity rate (%) Screened for TB Referred for clinical diagnosis Ugu 225,729 220,25698 208 504 106% 39,7091881,21429,322 Ethekweni 1,054,217 880,75984 1053 113 84%204,320 23701,380118,551 iLembe 153,254 145,48995 185 510 78%25,465 1891,42215,810 Amajuba 193,005 189,87798 178 223 106%34,023 1882,3879,645 Uthukela 195,324 191,90598 184 289 104% 38,734 20123,82627,104 Umzinyathi212,336 157,96774 128263 123% 23,267 15143,29924,448 Sisonke173,132 163,47294 138743 118%21,399 13136,58412,763 uMgungundlov u294,432 274,29593 322101 85%56,174 20 112 541 29 177 Uthungulu734,368 284,76739 260112 109% 45,594 16547,69239,026 Zululand267,110 245,41992 235060 104% 43,367 18130,19931,460 Umkhanyakude 183,360 166,22791 162 315 102% 29,005 17154,45619,455 Totals 3,686,2672,920,433 79 3059 234 95%561057 193,305 000356 761
 Campaign TargetTarget Achieved PositivePositivity rate (%) Screened for TB Referred for clinical diagnosis Ugu 225, , % 39, ,21429,322 Ethekweni 1,054, , %204, ,380118,551 iLembe 153, , %25, ,42215,810 Amajuba 193, , %34, ,3879,645 Uthukela 195, , % 38, ,82627,104 Umzinyathi212, , % 23, ,29924,448 Sisonke173, , %21, ,58412,763 uMgungundlov u294, , %56, Uthungulu734, , % 45, ,69239,026 Zululand267, , % 43, ,19931,460 Umkhanyakude 183, , % 29, ,45619,455 Totals 3,686,2672,920, % ,")
19
TargetActual 2010/2011186 703 2011/2012560 000 Total June 201154 689 2014/20152 333 788 AGES adult 15-49 years50 228 adult 50 years and older516 child 4 months to 14 years3 872 neonate 0-3 months73 MEDICAL MALE CIRCUMCISION

20
RECOMMENDATIONS Facilities and districts to mobilize and market the programme Urgent filling of roving teams’ post. NGOs to play a supportive and assistants’ role. Municipalities and other departments – COGTA, DOE, DAC to make an input in the implementation. Other stakeholders, traditional leadership, traditional healers, counsillors, Religious Sector being mobilised to input Discussions with SANC and HPCSA

21
200820092010 # STI treated424452428006440714 % Condom Distribution 18% male & 26% female ( 11 condoms per man per month) DOH REPORTS
 DOH REPORTS")
22
TREATMENT

23
ART Facilities and NIMART DISTRICTART Facilities March 2010 # of New ART Facilities (PHC’s) Total # Of ART Facilities June 2011 # Of Nurses Initiating SUB- DISTRICT ART Service Point Ethekwini 24 62 86 30100% Sisonke 7 26 33 17100% Ilembe 9 32 41 22100% Uthungulu 10 46 56 22100% Umkhanyakud 5 51 56 21100% Zululand 9 56 65 63100% Amajuba 4 17 21 0100% Umzinyathi 4 35 39 15100% Uthukela 3 24 27 5100% UMgungundlo 10 24 34 31100% Ugu 4 56 60 56100% TOTAL 89429518282100%
 Total # Of ART Facilities June 2011 # Of Nurses Initiating SUB- DISTRICT ART Service Point Ethekwini % Sisonke % Ilembe % Uthungulu % Umkhanyakud % Zululand % Amajuba % Umzinyathi % Uthukela % UMgungundlo % Ugu % TOTAL %")
24
ART2007/8 2009/10 2010/11 TargetActualTargetActualTargetActual # ART patie nts regist ered81614146537255000319015 478,922459,670 % ART Achie veme nt 180% 125% 96% ART EXPANSION

25
ART Expansion – June 2011 DISTRICTADULT MALESADULT FEMALES CHILDRENTOTAL#OF PATIENTS NIMART Ethekwini49 614 96 02814 404160 046 908 Sisonke 5 681 12 549 1 786 20 016 357 Ilembe 8 608 15 105 2 971 26 684 644 Uthungulu15 923 29 974 4 337 50 234 388 Umkhanyaku11 259 21 887 3 596 36 742 247 Zululand10 632 19 869 2 146 32 647 4 423 Amajuba 8 247 12 370 1 743 22 360 0 Umzinyathi 9 727 13 656 2 133 25 516 1 352 Uthukela 9 385 16 915 2 391 28 691 55 UMgungundl15 246 35 116 5 727 56 089 704 Ugu 8 401 19 461 2 914 30 776 933 TOTAL152 723292 930 44 148489 80110 020

26
KZN PROVINCIAL: TB SUSPECTS Qrt 3 / 2010 – Qrt 1 / 2011 Qrt 1 /2011Qrt 4 / 2010Qrt 3 / 2010 #%#%#% Total Number of Outpatients (headcount > 5yrs) 471863849716563938625 Number (%) Suspects 1107732.3%1272253%1372793% Number (%) Suspects Tested 11837693.0%10198592%12047788% Number (%) Positive 68776.7%81836.9%77856.5% Number (%) on Treatment 518575.3%732590%725993.2%
 Number (%) Suspects % % % Number (%) Suspects Tested % % % Number (%) Positive % % % Number (%) on Treatment %732590% %")
27
KZN PROVINCIAL TB CASE FINDING: Qrt 3 / 2010 – Qrt 1 / 2011 Q1/2011Q4/2010Q3/2010 ALL TB 173412972632525 PTB 1475425113 26927% Of All TB SM+VE 574490238710 % Of All PTB NO SMEAR 4119801410191 % Of All PTB SMEAR-VE 489180768026 % Of All PTB EXTRA PULMONARY 258746135597 % Of All PTB BACTERIOLOGICAL COVERAGE80.4%78.1%71.3%

28
KZN Smear Conversion Rate Qrt 3 / 2010 – Qrt 1 / 2011 New Patients Q1/2011Q4/2010 Qrt 3/ 2010 #% Converted 495766.3%390057.4%464368.0% Still Positive 3995.3%2864.2%3786.0% No Smear 165822.2%208730.7%128419.0% Defaulted 1001.3%1091.6%1192.0% Died 1562.1%1672.5%1873.0% Transferred 2062.8%2453.6%2524.0% Total747667946863

29
KZN Smear Conversion Rate Qrt 3 / 2010 – Qrt 1 / 2011 Re- Treatment Patients Qrt 2 / 2011Qrt 1 / 2011Qrt 4 / 2010 #%#%#% Converted 54832.4%40628.0%47431.4% Still Positive 492.9 %402.8%372.4% No Smear 93155.1%86259.4%88358.4% Defaulted 412.4%241.7%271.8% Died 663.9%664.5%563.7% Transferred 563.3%533.7%342.3% Total 169114511511

30
KZN PROVINCIAL TREATMENT OUTCOME: NEW SM+VE: Q4/2009 – Q2/2010 Q2/2010 Q1/2010 Q4/2009 #%#%#% SMEAR +VE REPORTED693169128909 CURE RATE469367.7%482069.7%581065.2% Rx COMPLETED3975.7%4516.5%5816.5% DEFAULTER RATE4776.9%5538.0%6357.1% FAILURE RATE991.4%1382.0%1351.5% DEATH RATE4446.4%4406.4%6086.8% TRANSFER RATE2774.0%3495.0%4435.0% NOT EVALUATED5447.8%1612.3%6977.8%

31
KZN PROVINCIAL TREATMENT OUTCOME: Re-Treatment : Q4 / 2009 – Q2/2010 Q2/2011 Q1/2011 Q4/2009 #%#%#% Cases REPORTED123813241390 CURE RATE58847.5%66650.3%69449.9% Rx COMPLETED14611.8%16412.4%17412.5% DEFAULTER RATE16113.0%19014.4%15811.4% FAILURE RATE302.4%362.7%241.7% DEATH RATE1219.8%13610.3%1319.4% TRANSFER RATE655.3%654.9%876.3% NOT EVALUATED12710.3%675.1%1228.8%

32
TB/HIV Integration Progress with TB/HIV integration – all facilities implementing both HIV and TB services Improved screening of TB amongst HIV positive patients Increased uptake of IPT 124,963 pts – 71.5% towards target of 170 000 pts by June 2011

33
Newly Diagnosed TB Cases (New + Re-treatment cases) Quart/Year Q1/ 2011 Quart/Year Q4 /2010_ Quart/Year Q3/2010_ #%#%#% Number of Newly Diagnosed TB Cases 227962082720494 Number of Newly Diagnosed TB counselled for HIV 2048890.0%1868190.0%1608879.0% Number of Newly Diagnosed TB cases who tested for HIV 1744385.0%1471679.0%1239877.0% Number of Newly Diagnosed TB cases who tested positive 1139765.3%929363.0%902173.0% Number of Newly Diagnosed TB HIV+ cases started CPT 872077.0%680573.0%533959.0% Number of Newly Diagnosed TB HIV+ cases already on CPT 404346.0%525677.0%406276.0% Total of Newly Diagnosed TB HIV+ cases started on ART 290372.0%303158.0%237759.0% Total Number of TB/HIV Co-infected patients on ART 46291.6%52251.7%38371.6% Total Number of HIV+ve patients started TB Treatment 112588359505 KZN PROVINCIAL: TB/HIV Qrt 1 / 2011
 Quart/Year Q1/ 2011 Quart/Year Q4 /2010_ Quart/Year Q3/2010_ #%#%#% Number of Newly Diagnosed TB Cases Number of Newly Diagnosed TB counselled for HIV % % % Number of Newly Diagnosed TB cases who tested for HIV % % % Number of Newly Diagnosed TB cases who tested positive % % % Number of Newly Diagnosed TB HIV+ cases started CPT % % % Number of Newly Diagnosed TB HIV+ cases already on CPT % % % Total of Newly Diagnosed TB HIV+ cases started on ART % % % Total Number of TB/HIV Co-infected patients on ART % % % Total Number of HIV+ve patients started TB Treatment KZN PROVINCIAL: TB/HIV Qrt 1 / 2011")
34
Newly Diagnosed TB Cases (New + Re-treatment cases) Quart/Year Q2/ 2011 Quart/Year Q4 /2010 Quart/Year Q3/2010_ #%#%#% Number of Newly Diagnosed TB Cases 186372131320827 Number of Newly Diagnosed TB counselled for HIV 1530582.2%1907189.4%1868190.0% Number of Newly Diagnosed TB cases who tested for HIV 1279283.5%1564882.0%1524481.6% Number of Newly Diagnosed TB cases who tested positive 866768.0%1042866.6%929361.0% Number of Newly Diagnosed TB HIV+ cases started CPT 652975.3%807577.4%680573.2% Number of Newly Diagnosed TB HIV+ cases already on CPT 352954.0%469258.1%525677.2% Total of Newly Diagnosed TB HIV+ cases started on ART 344097.4%258855.1%298457.0% Total Number of TB/HIV Co-infected patients on ART 52381.52%44631.72%52381.75% Total Number of HIV+ve patients started TB Treatment 1015999698588 KZN PROVINCIAL: TB/HIV Qrt 2 / 2011
 Quart/Year Q2/ 2011 Quart/Year Q4 /2010 Quart/Year Q3/2010_ #%#%#% Number of Newly Diagnosed TB Cases Number of Newly Diagnosed TB counselled for HIV % % % Number of Newly Diagnosed TB cases who tested for HIV % % % Number of Newly Diagnosed TB cases who tested positive % % % Number of Newly Diagnosed TB HIV+ cases started CPT % % % Number of Newly Diagnosed TB HIV+ cases already on CPT % % % Total of Newly Diagnosed TB HIV+ cases started on ART % % % Total Number of TB/HIV Co-infected patients on ART % % % Total Number of HIV+ve patients started TB Treatment KZN PROVINCIAL: TB/HIV Qrt 2 / 2011")
35
CARE AND SUPPORT

36
Year Foster Care CSG TOTAL NO OF CHILDRE N 4/2008 1206043135320604212212378 4/2009 1212833320922377952392287 4/2010 1414543671024406902618854 4/2011 1343773721126254782797066 GRANTS IN THE PROVINCE

37
Care and Support Support Groups for People Living with HIV – 546 support groups for PLHIV established in the 11 districts with the total of 12,220 people participating – Support group facilitators workshoped on HIV toolkit, which covers disclosure, living positively with HIV and facilitation skills HCBC Programme

38
PMTCT

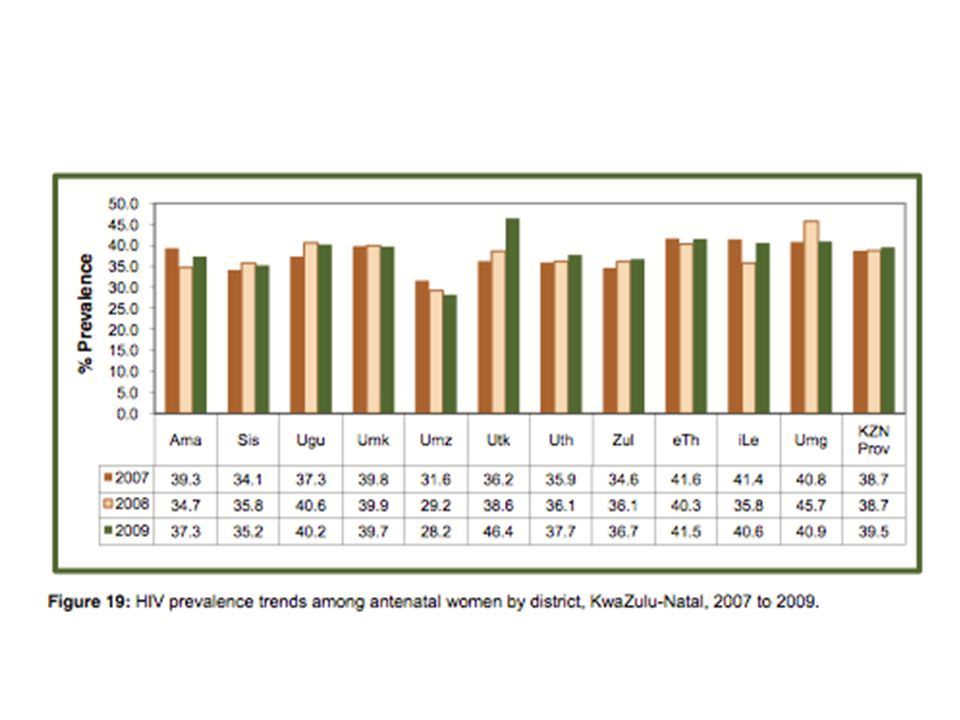
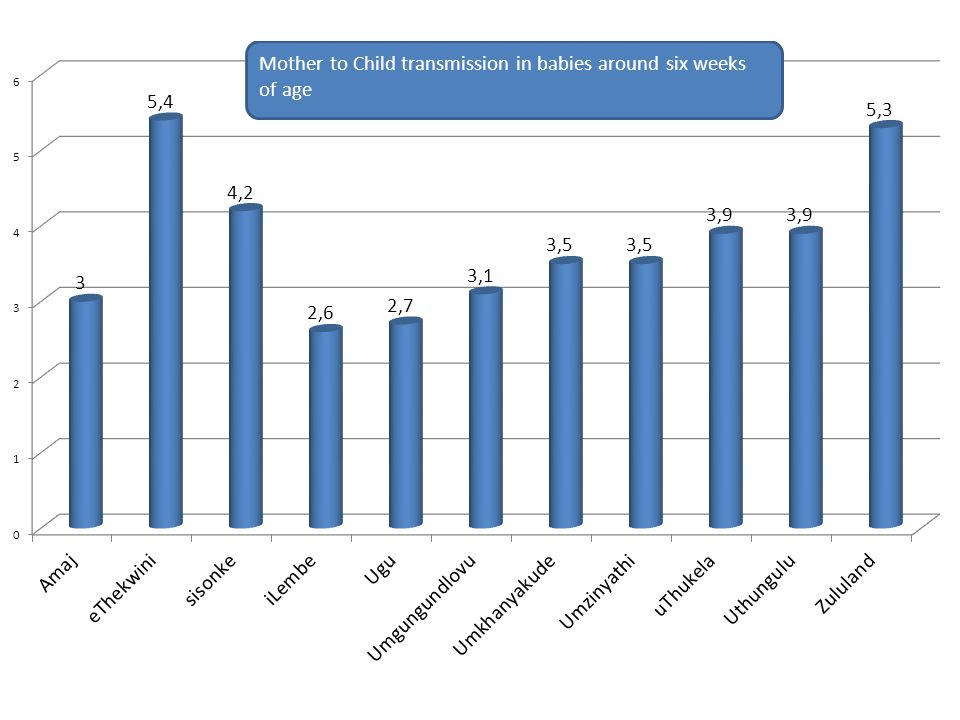
39
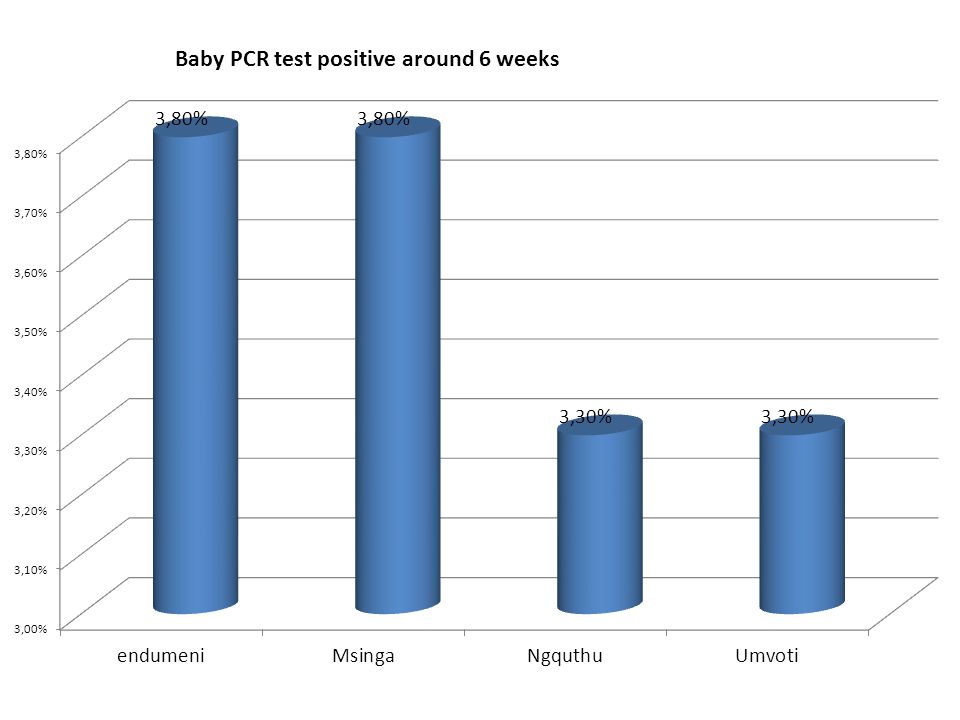
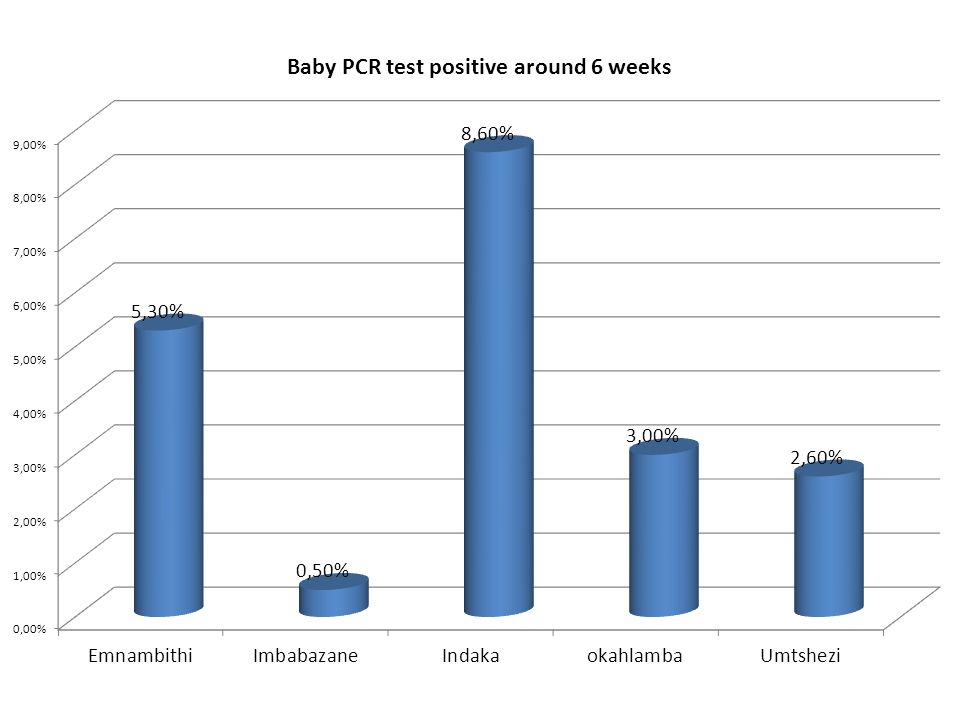
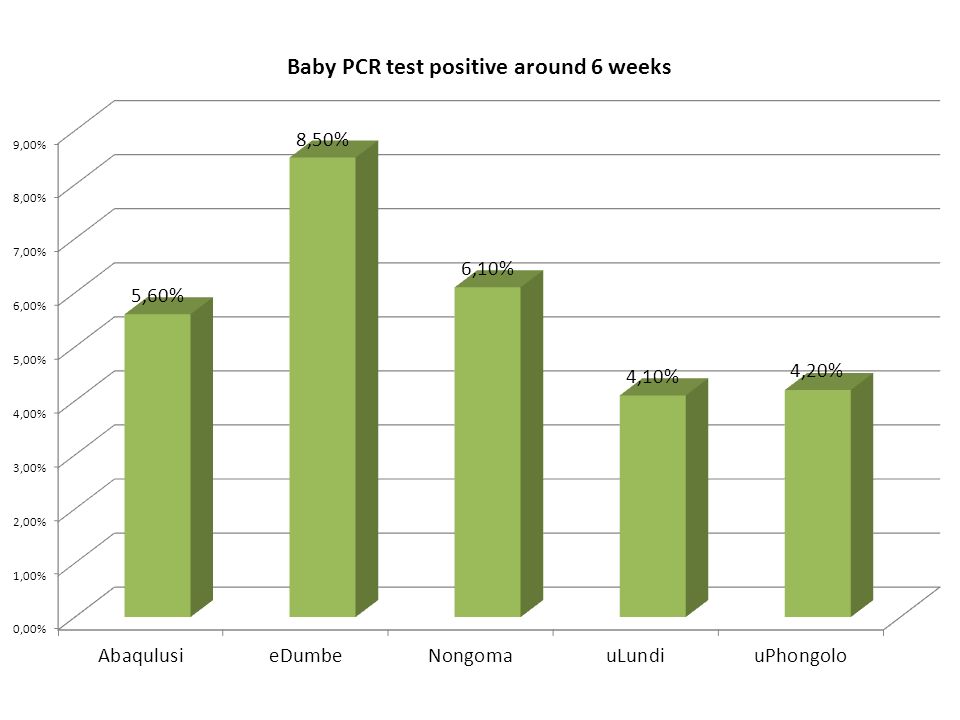
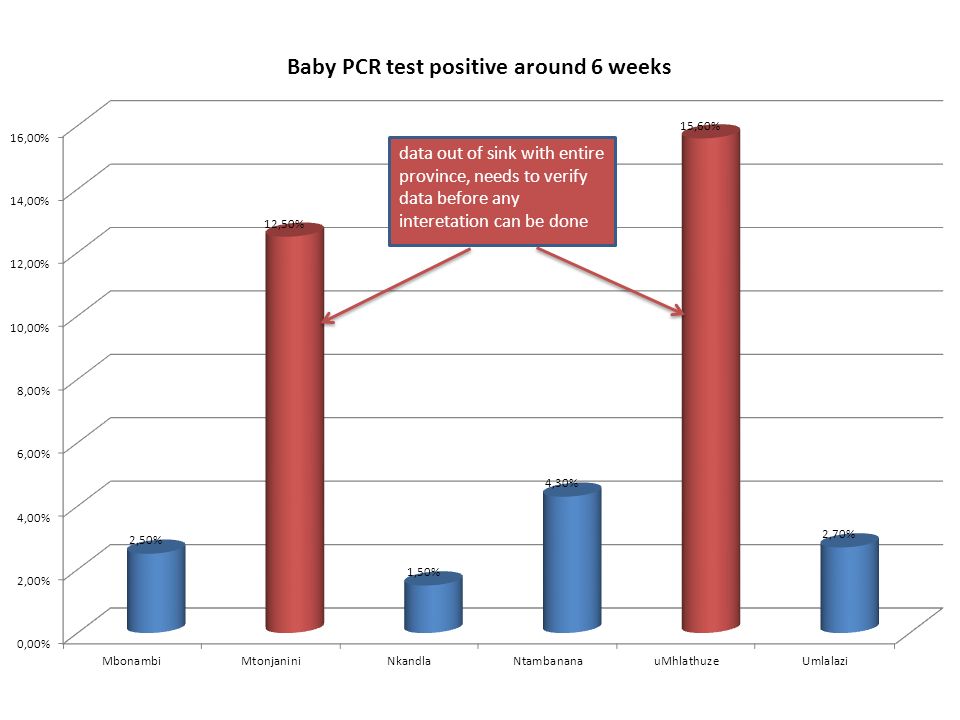
Mother to child transmission of HIV Transmission measured Aug 2010 within the general population of Children who attended PNC Data Source: MRC 2011

41
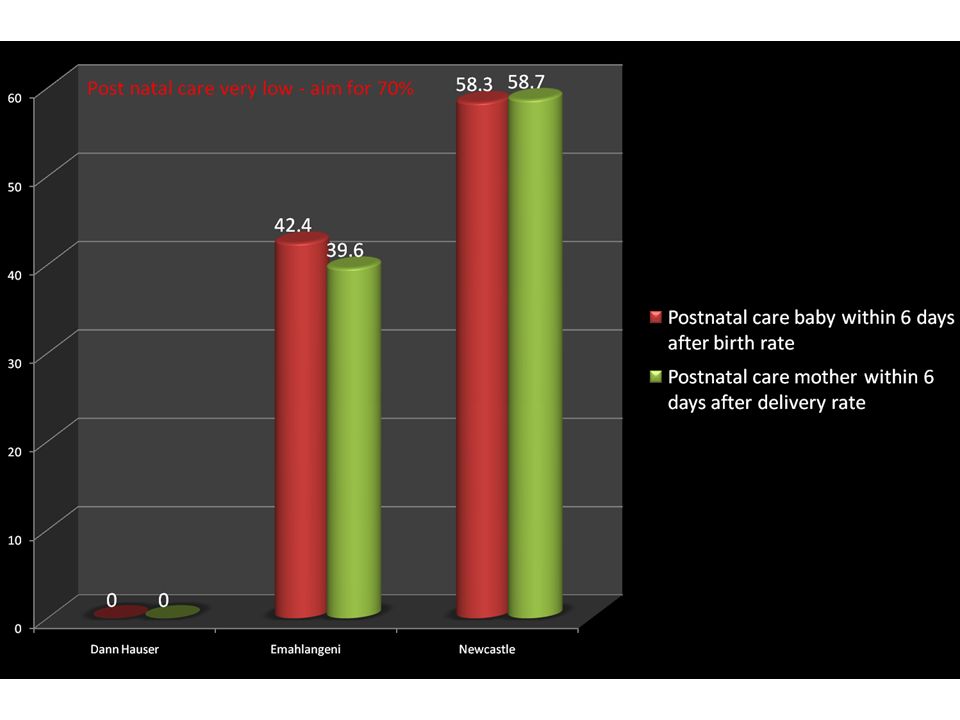
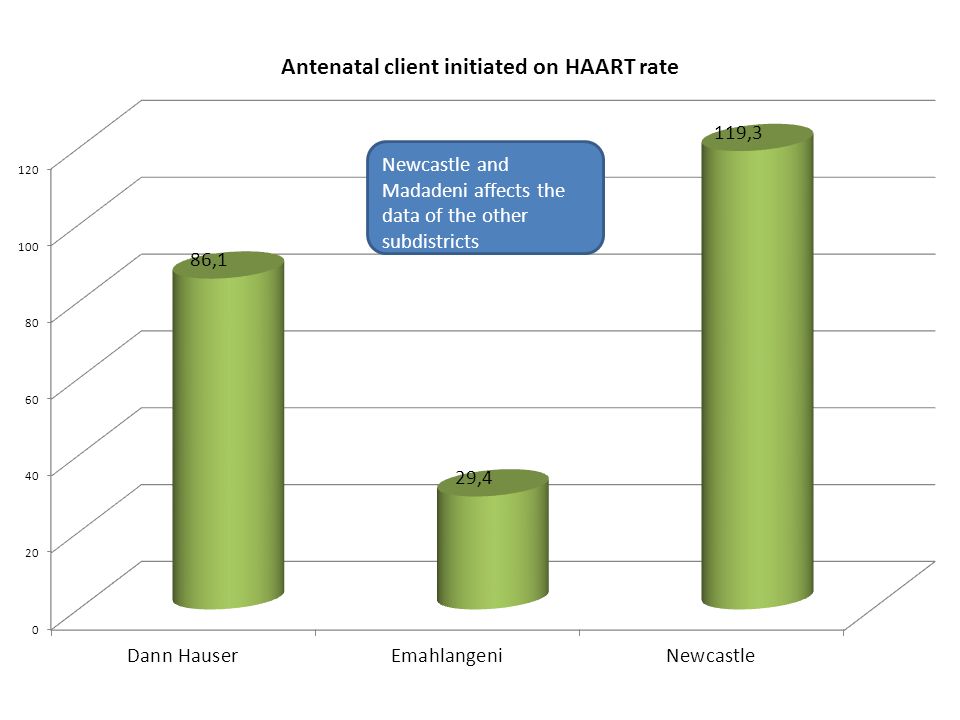
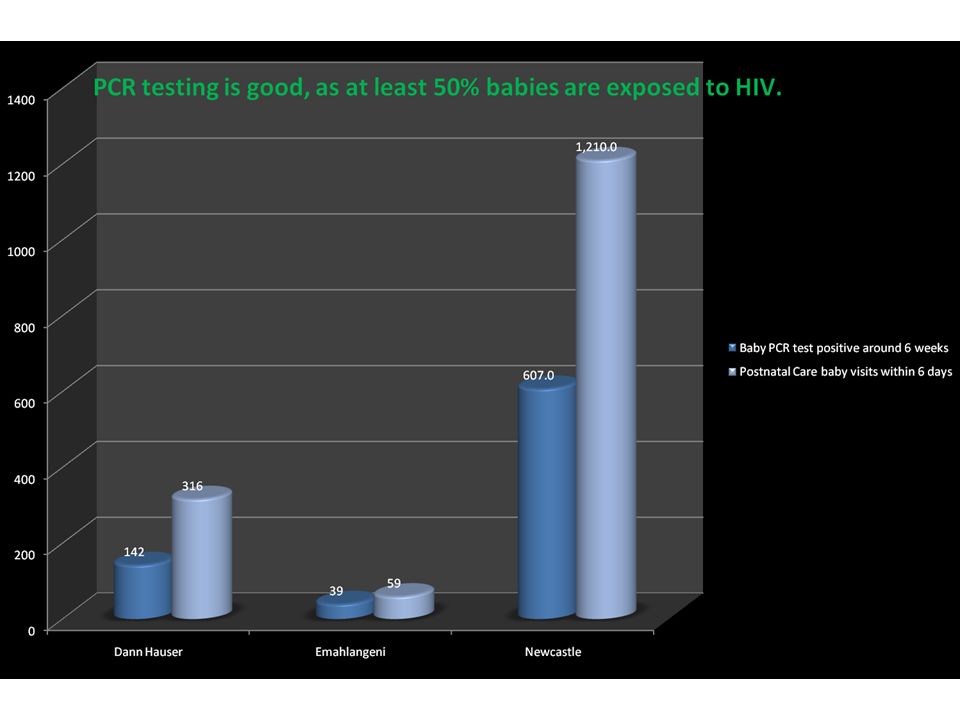
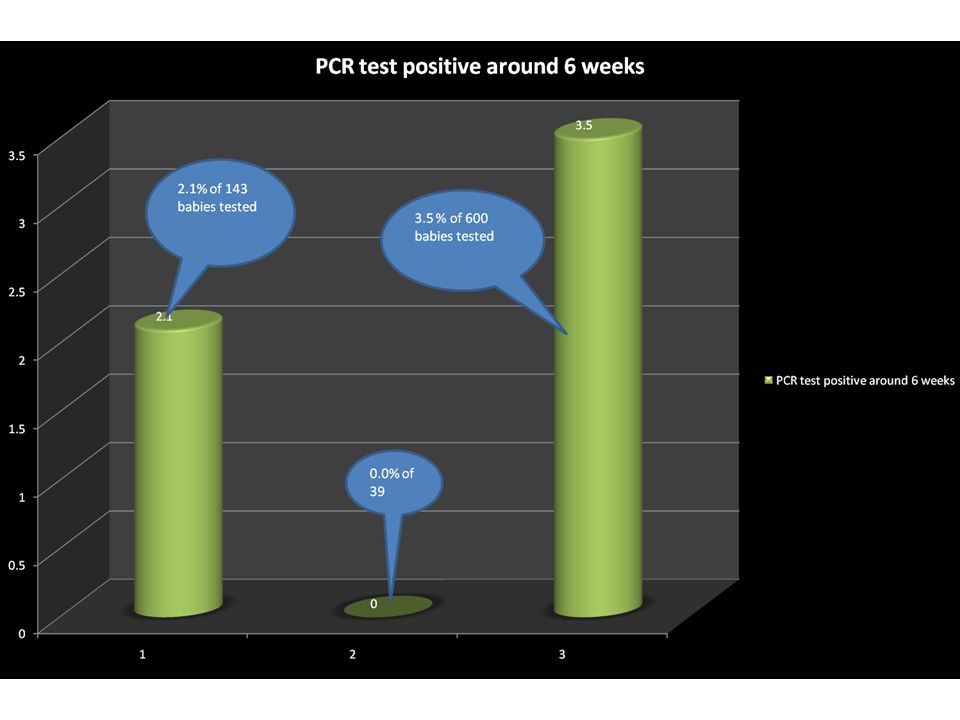
AMAJUBA

48
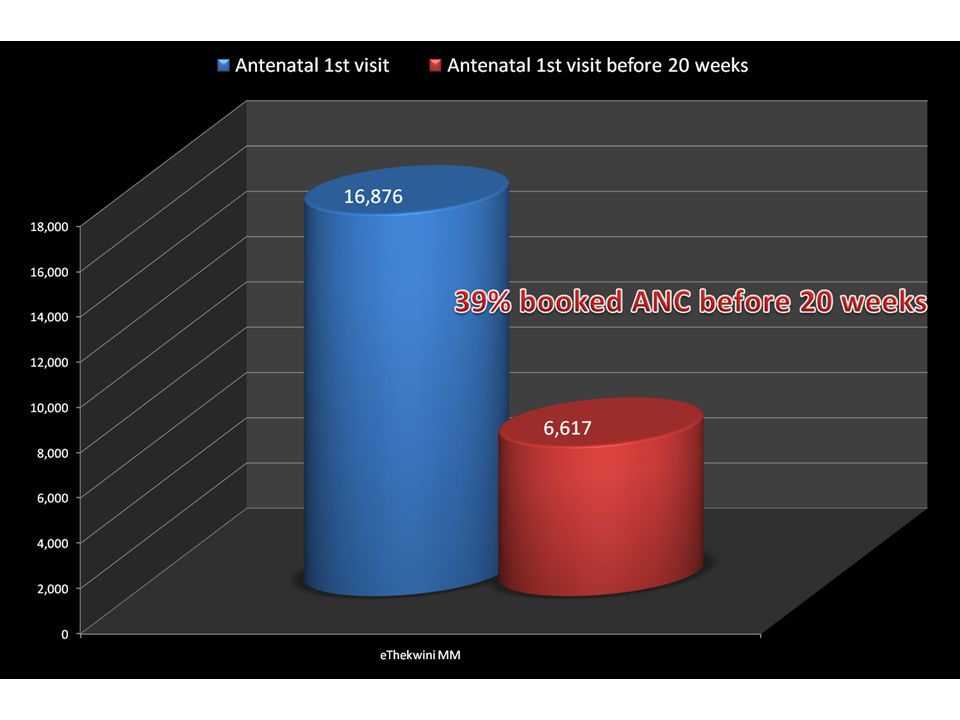
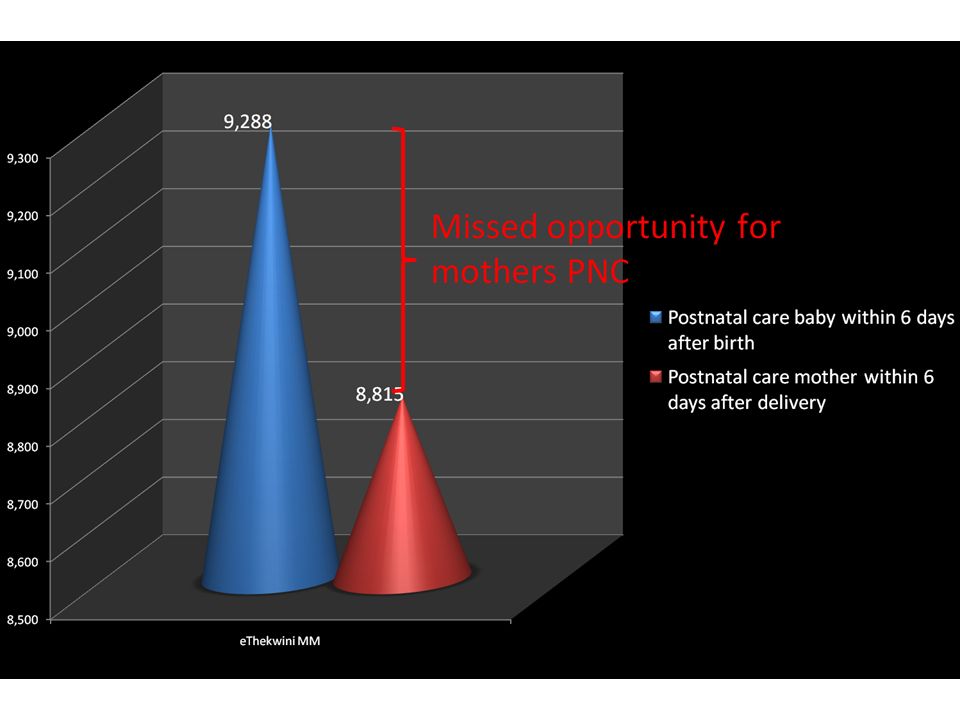
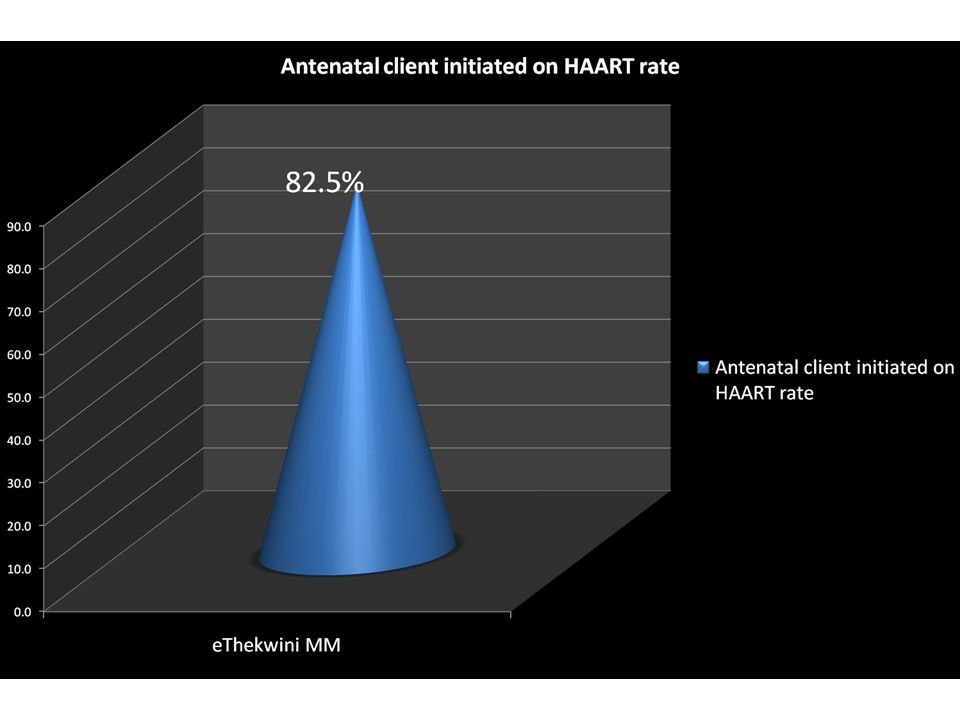
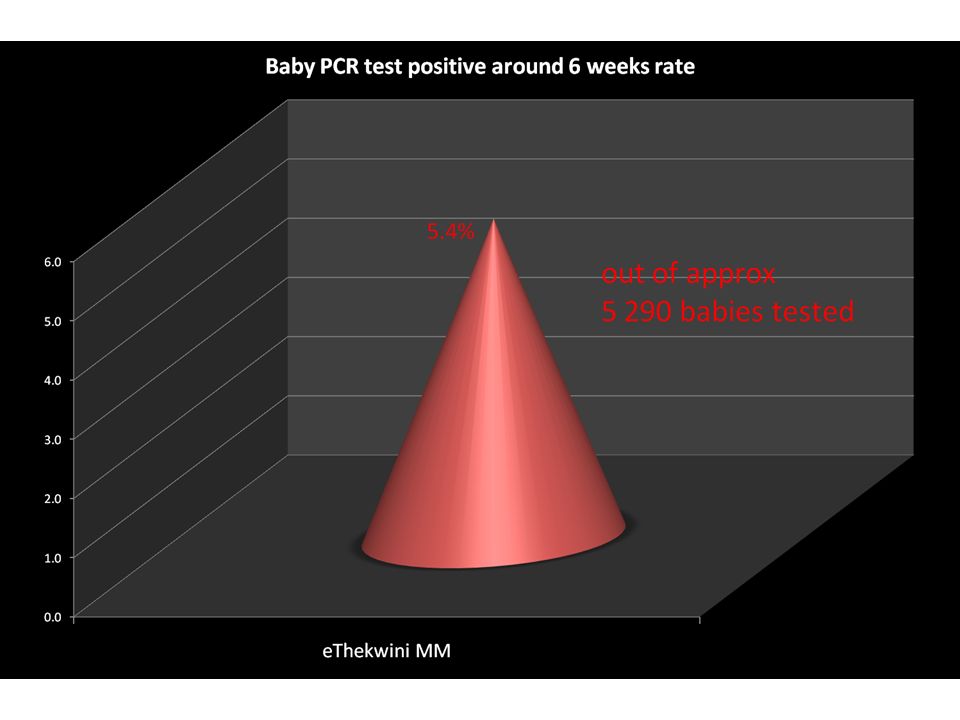
eTHEKWINI

54
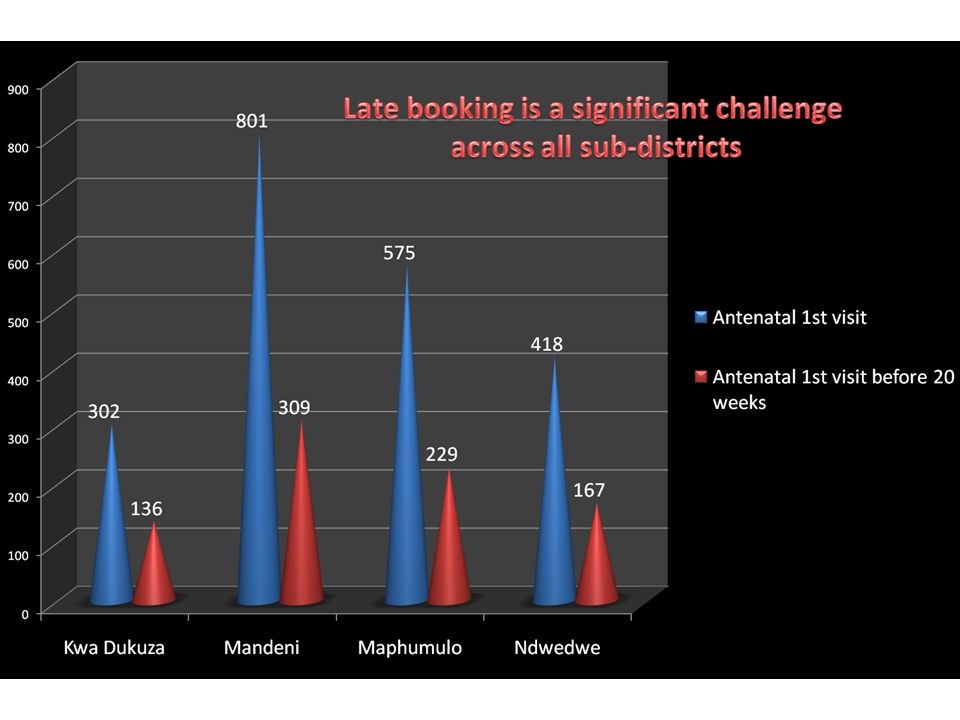
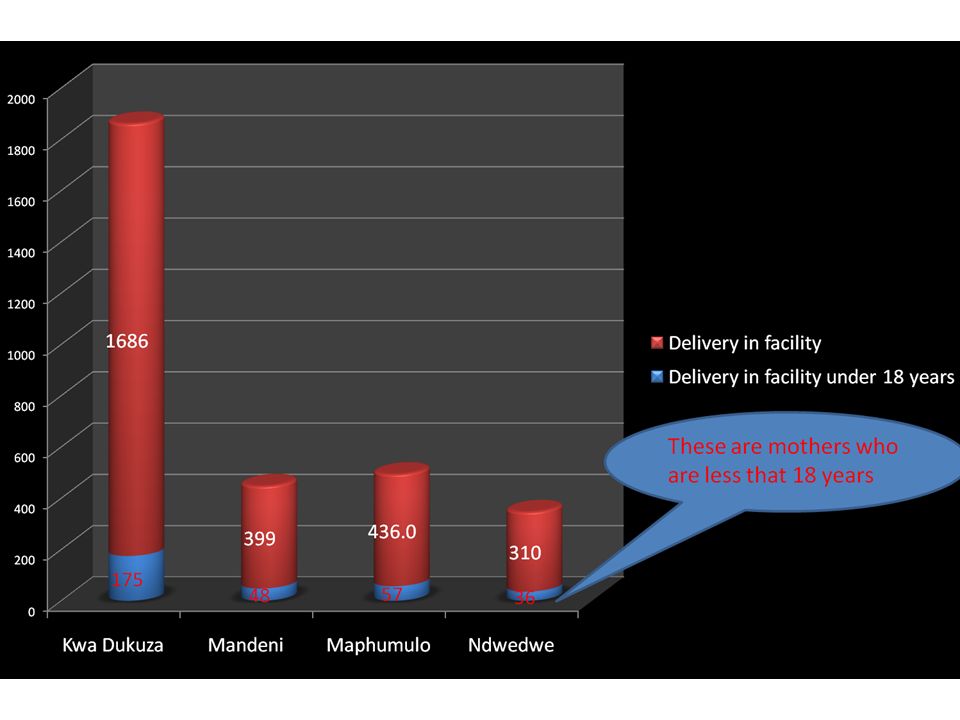
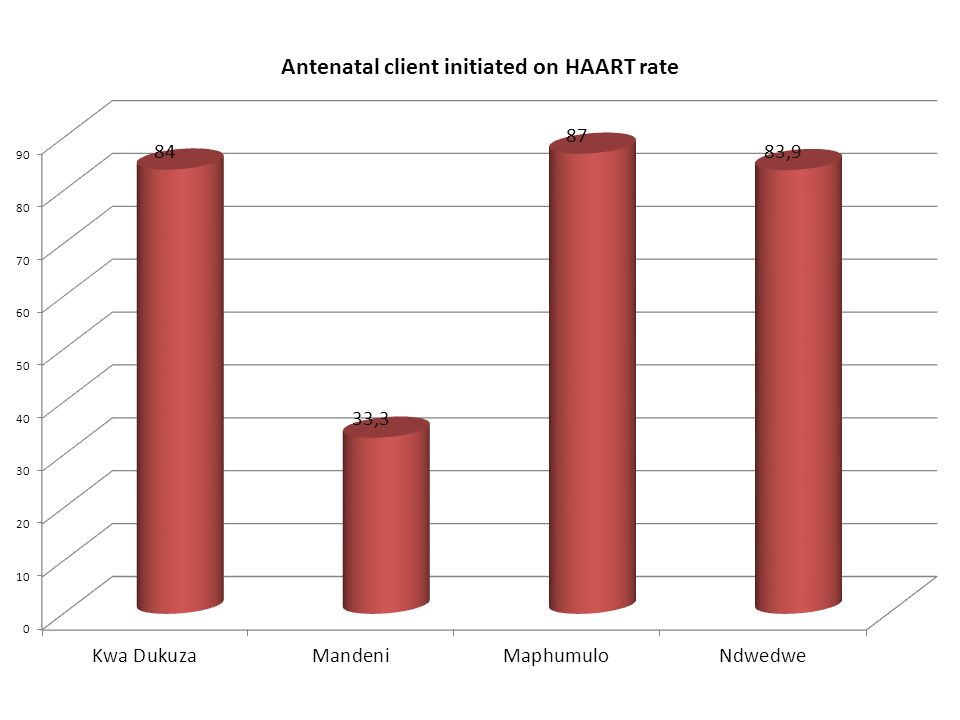
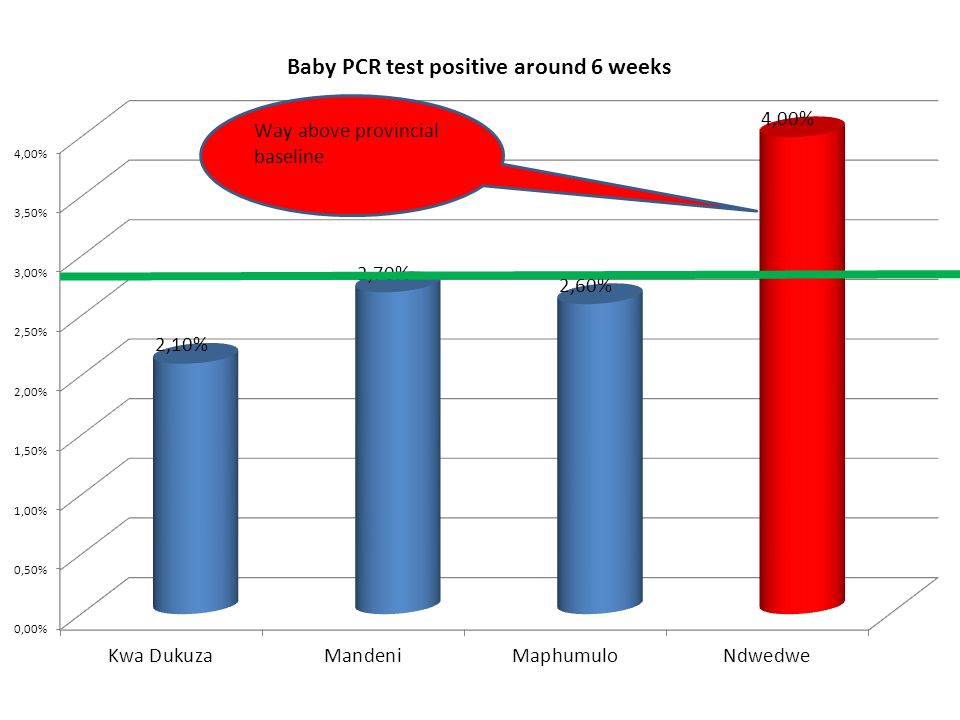
ILEMBE

60
SISONKE

66
UGU

71
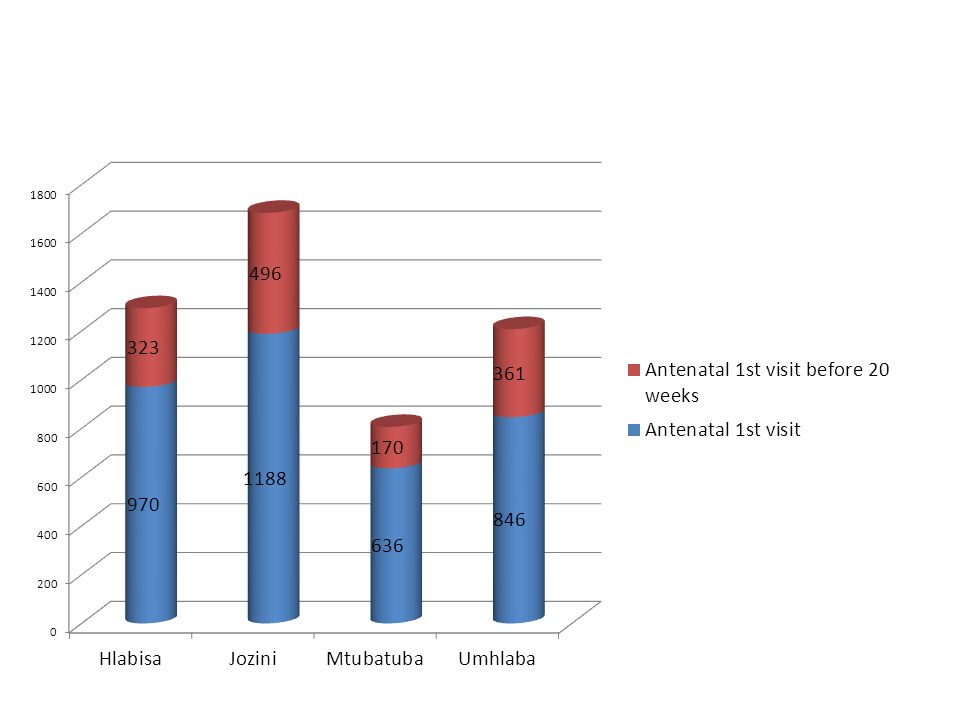
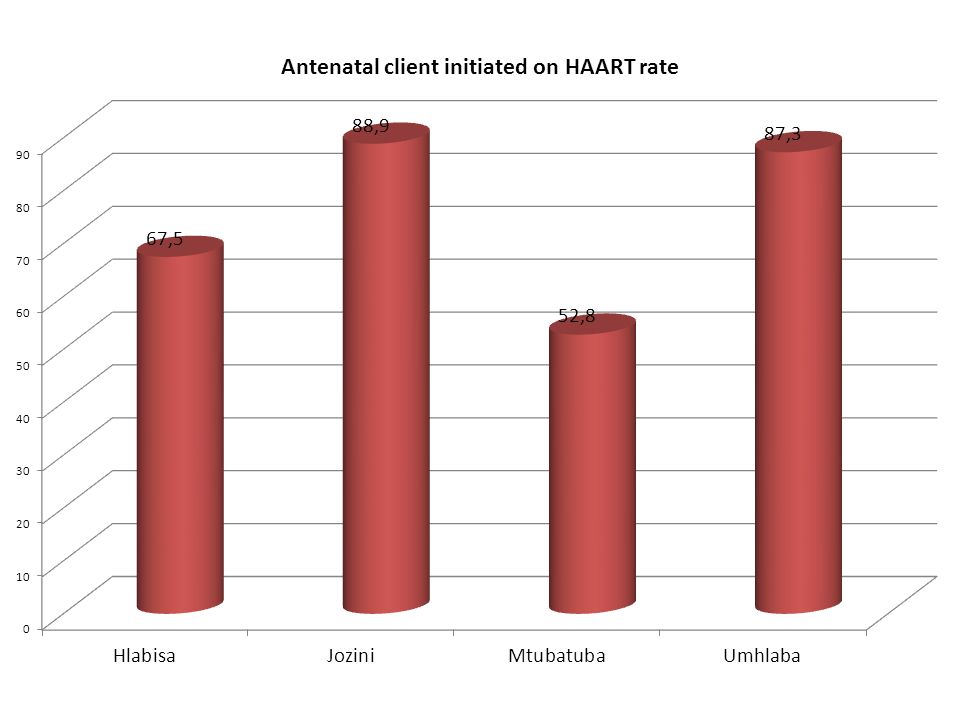
UMKHANYAKUDE

74
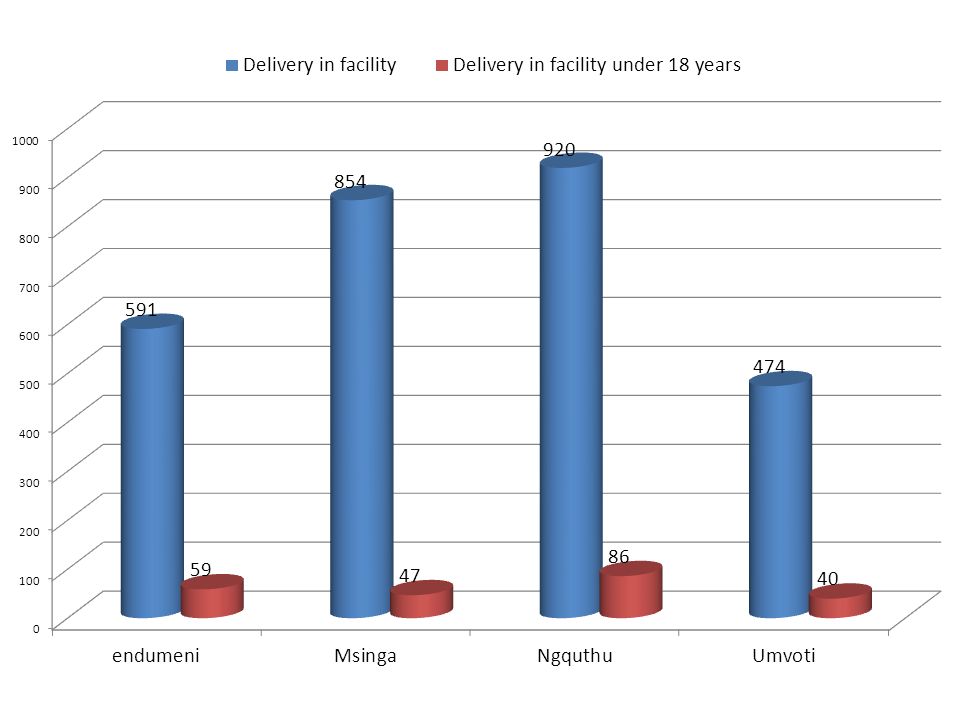
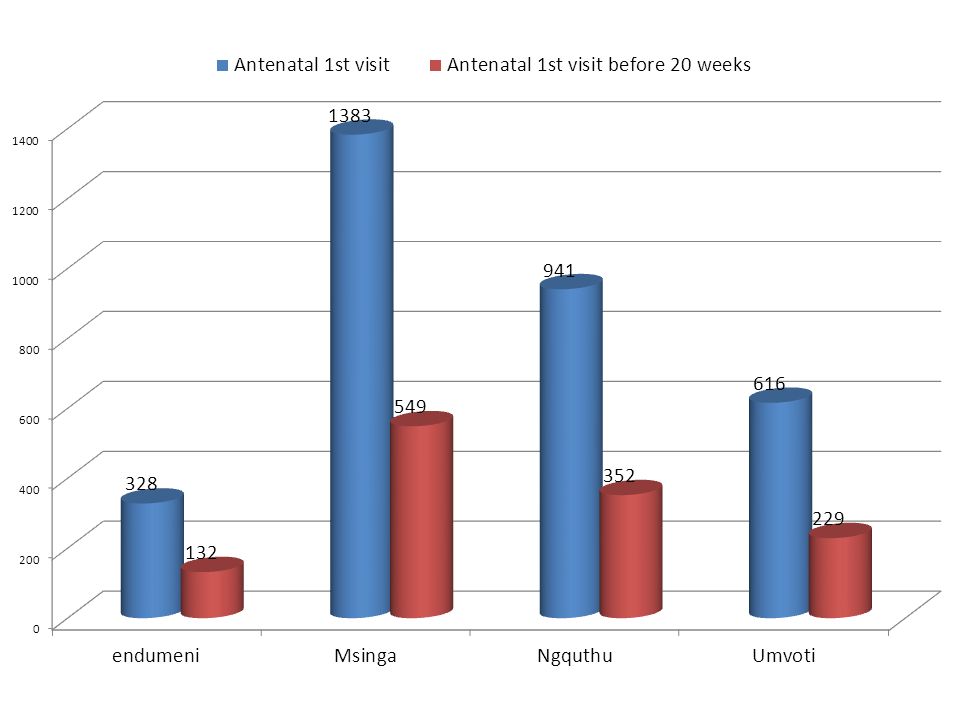
UMZINYATHI

79
uThukela

84
Uthungulu

89
Zululand

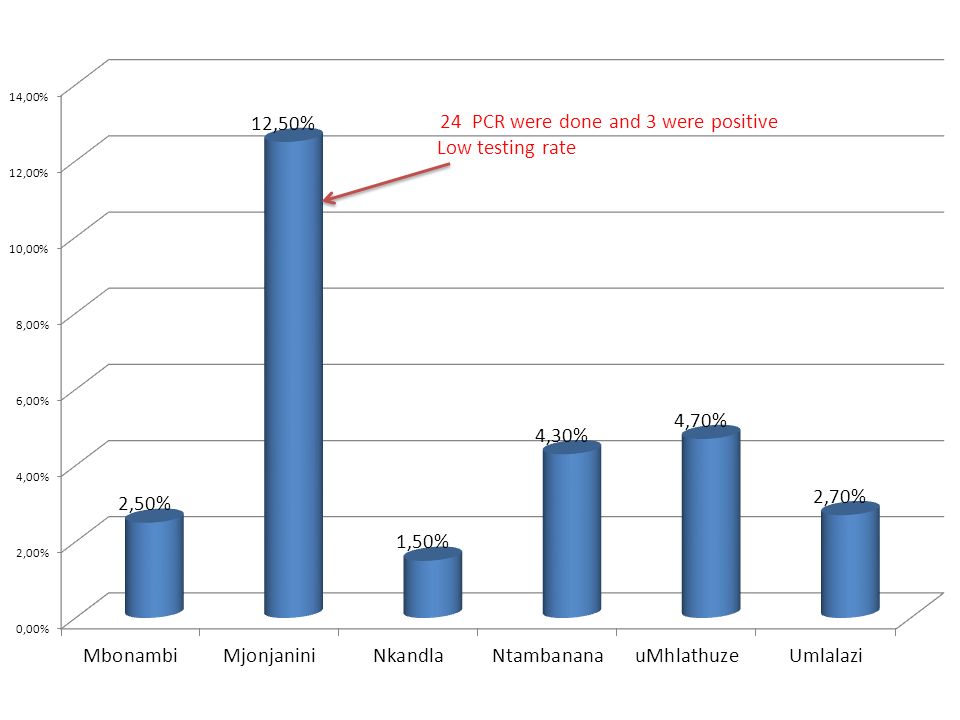
95
The Local AIDS Councils and Ward Committees The Local AIDS Council structures are to ensure that Ward AIDS Committees are supported with regards to the following issues: Reduction of Defaulter rate – TB & HIV and AIDS Treatment Compliance Support, Care and Compassion Fighting Stigma Awareness and Advocacy Teaching Ward Committees Comprehensive Response to HIV and AIDS Teenage Pregnancy and Family Planning Distribution of Condoms Human Rights and Gender - Mainstreaming Domestic Violence and Rape Intergenerational Sex Orphan and Vulnerable Care (Disability/Senior Citizens/Youth in distress) Youth Awareness – Adolescent and Reproductive Health Substance Abuse – Alcohol and Drugs
 Youth Awareness – Adolescent and Reproductive Health Substance Abuse – Alcohol and Drugs")
Similar presentations


 Rate of.>")


