Download presentation
Presentation is loading. Please wait.

1
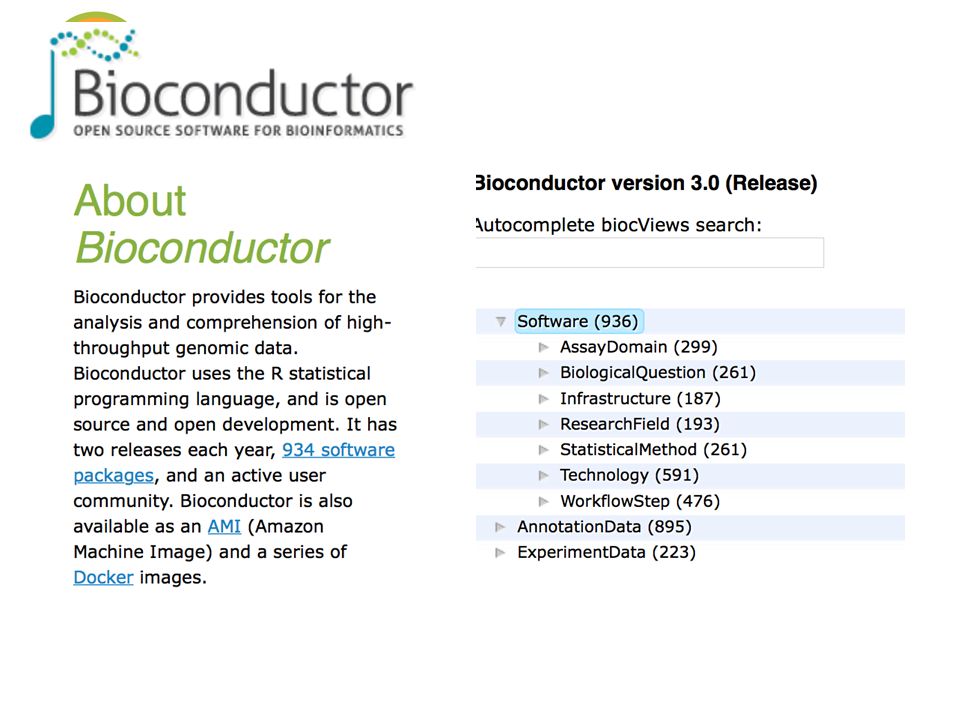
Lawrence Hunter, Ph.D. Director, Computational Bioscience Program University of Colorado School of Medicine Larry.Hunter@uchsc.edu http://compbio.uchsc.edu/Hunter Microarrays Tzu Lip Phang, Ph.D. Associate Professor of Bioinformatics Division of Pulmonary Sciences and Critical Care Medicine University of Colorado School of Medicine Tzu.Phang@ucdenver.edu

2
Data Science AKA BIG DATA

3
The Devils is in the Details

5
Workshop

6
The Central Dogma Transcriptome Genome

7
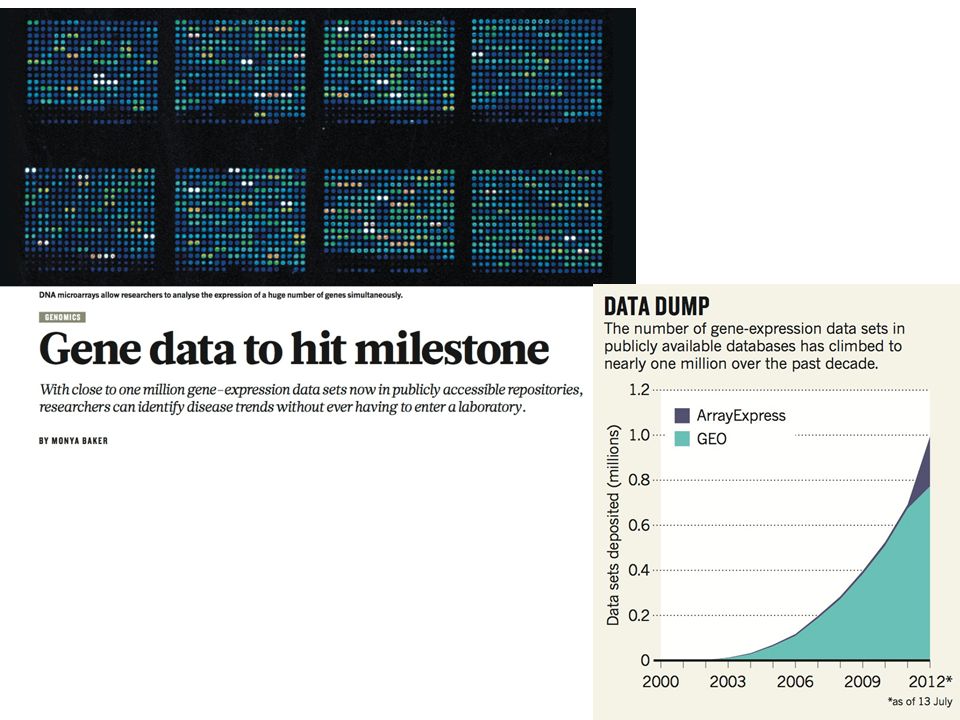
Microarrys in the Literature

9
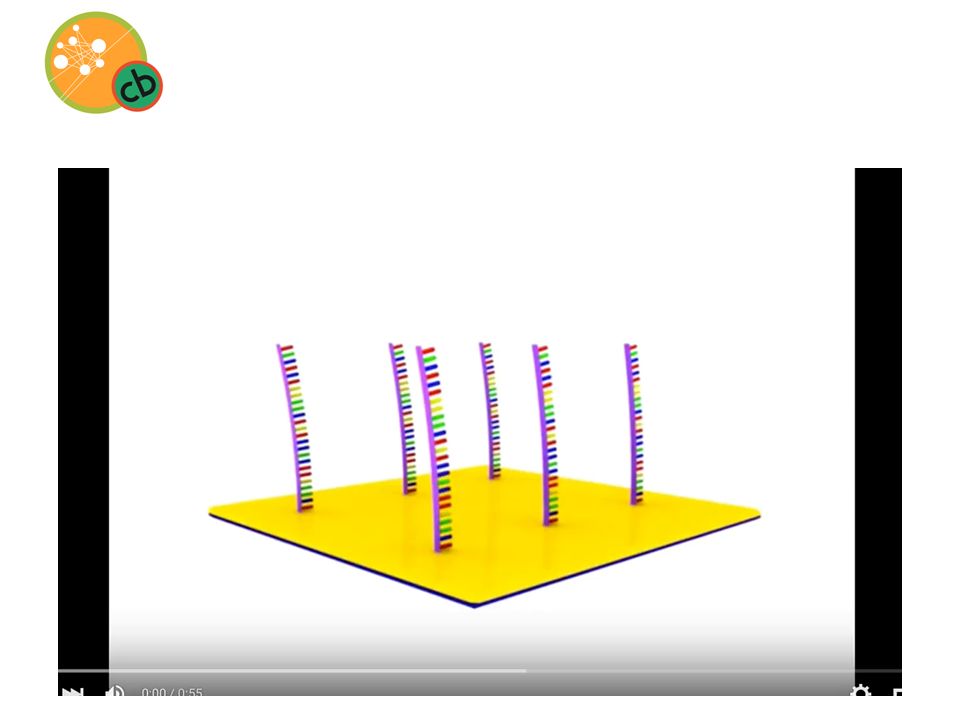
Microarray: Primer

11
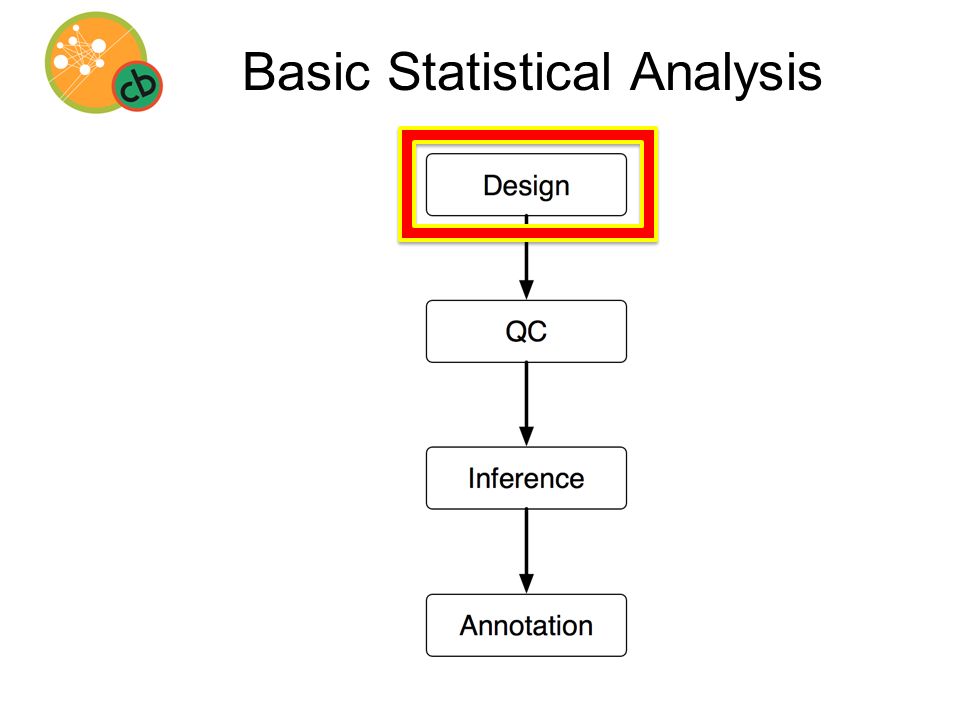
Basic Statistical Analysis

13
Power Analysis How many biological replication? My experience; at least 3, preferably 5, even 7 Bioconductor: SSPA

14
Basic Statistical Analysis

15
QC Including image analysis, normalization, and data transformation Data normalization: – Remove systematic errors introduced in labeling, hybridization and scanning procedures – Correct these errors while preserve biological variability / information

16
Why normalization?

17
To normalize or not to …

18
Basic Statistical Analysis

19
Statistical Testing Hypothesis Testing: Is the means of two groups different from each other – Fold Change – Student-T Test

20
Student-T Test

21
What is Multiple Comparison Testing??! GenesP-values Critical levelHo Gene 10.0001<=0.051 Gene 20.0002<=0.051 Gene 30.008<=0.051 Gene 40.009<=0.051 Gene 50.005<=0.051 Gene 60.09<=0.050 Gene 70.05<=0.050 Gene 80.09<=0.050 Gene 90.2<=0.050 Gene 100.3<=0.050 Alpha level = 0.05

22
When large number of tests … GenesP-values Critical levelHo Gene 10.0001<=0.051 Gene 20.0002<=0.051 Gene 30.008<=0.051 Gene 40.009<=0.051 Gene 50.005<=0.051 Gene 60.09<=0.050 …………… …………… Gene 9990.2<=0.050 Gene 10000.3<=0.050 Alpha level = 0.05 50 wrong genes …

23
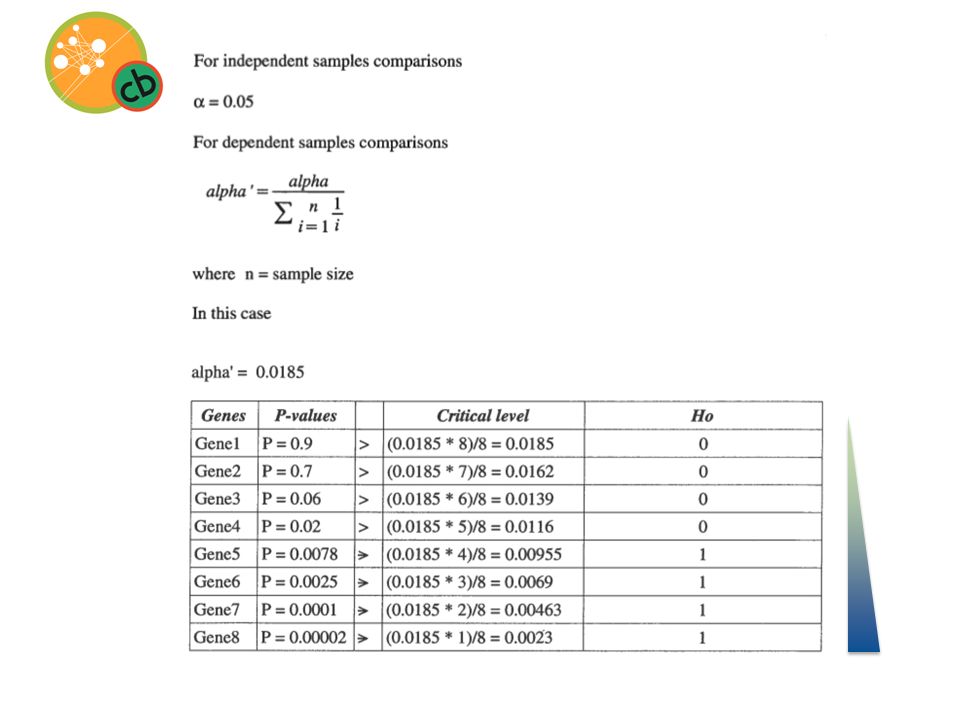
Correction … Bonferroni GenesP-values Critical levelHo Gene 10.0001<=0.000050 Gene 20.0002<=0.000050 Gene 30.008<=0.000050 Gene 40.009<=0.000050 Gene 50.005<=0.000050 Gene 60.09<=0.000050 ……… … ……… … Gene 9990.2<=0.000050 Gene 10000.3<=0.000050 Alpha level = 0.05 / 1000 = 0.00005

24
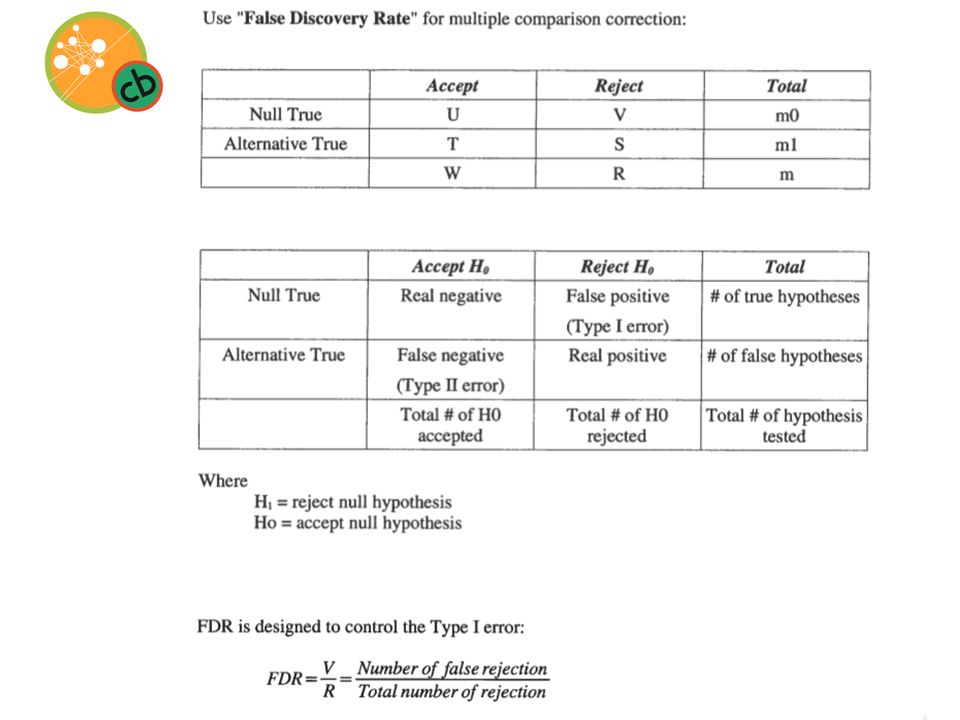
Strike the balance … BonferroniNo correction False Discovery Rate Most ConservativeMost Lenient The False Discovery Rate (FDR) of a set of predictions is the expected percent of false predictions in the set of predictions. Example: If the algorithm returns 100 genes with false discovery rate of 0.3, then we should expect 70 of them to be correct

27
Put them together

28
Basic Statistical Analysis

29
Biological Interpretation

Similar presentations

 = 113.5 bp median(nucs) = 110 bp sd(nucs+ = 17.3.>")

>")


