Download presentation
Presentation is loading. Please wait.

1
Math 3680 Lecture #18 Correlation

2
The Correlation Coefficient: Intuition

3
Lingo: Age = independent variable Height = dependent variable

4
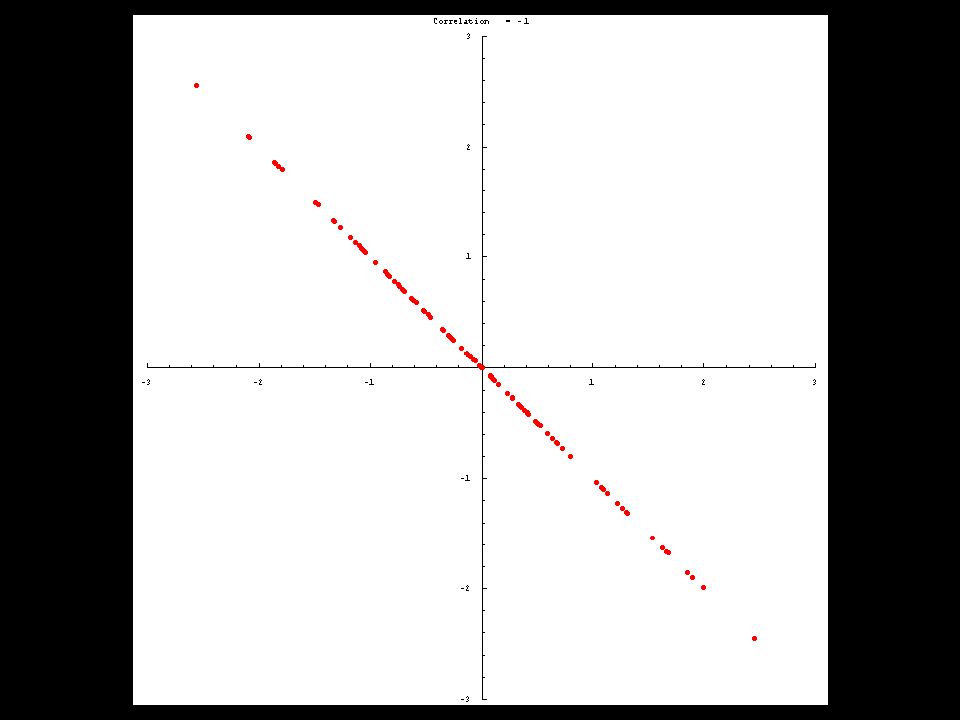
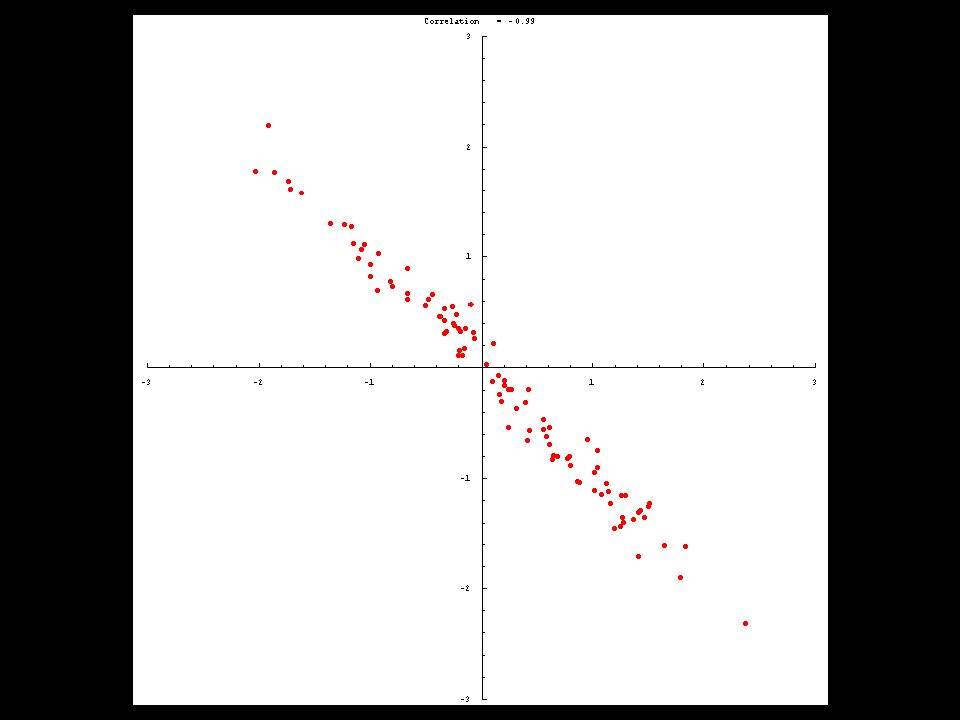
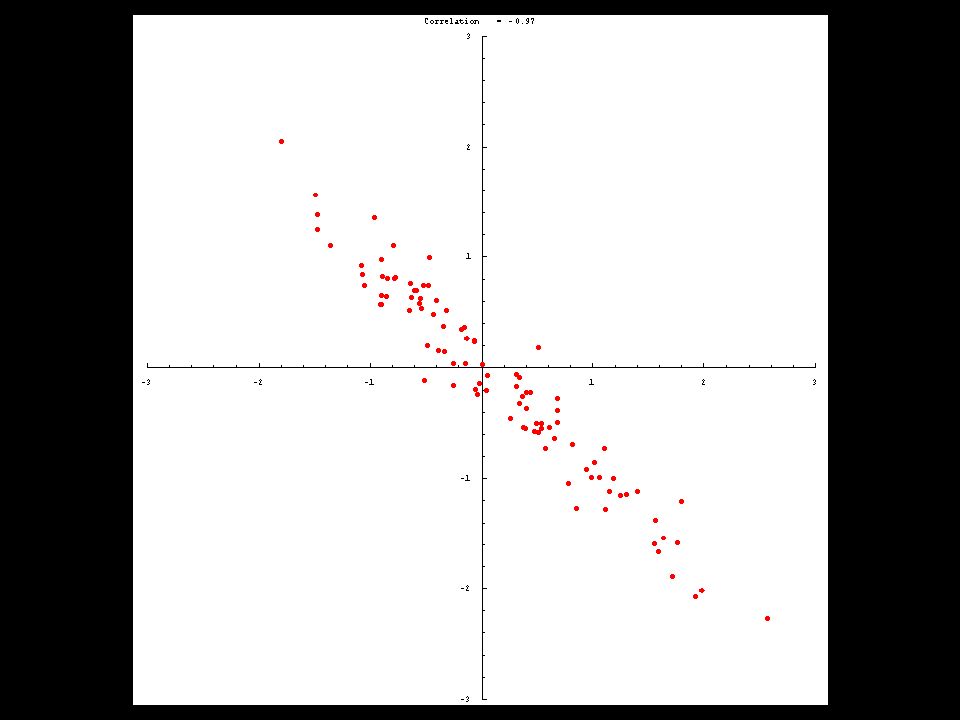
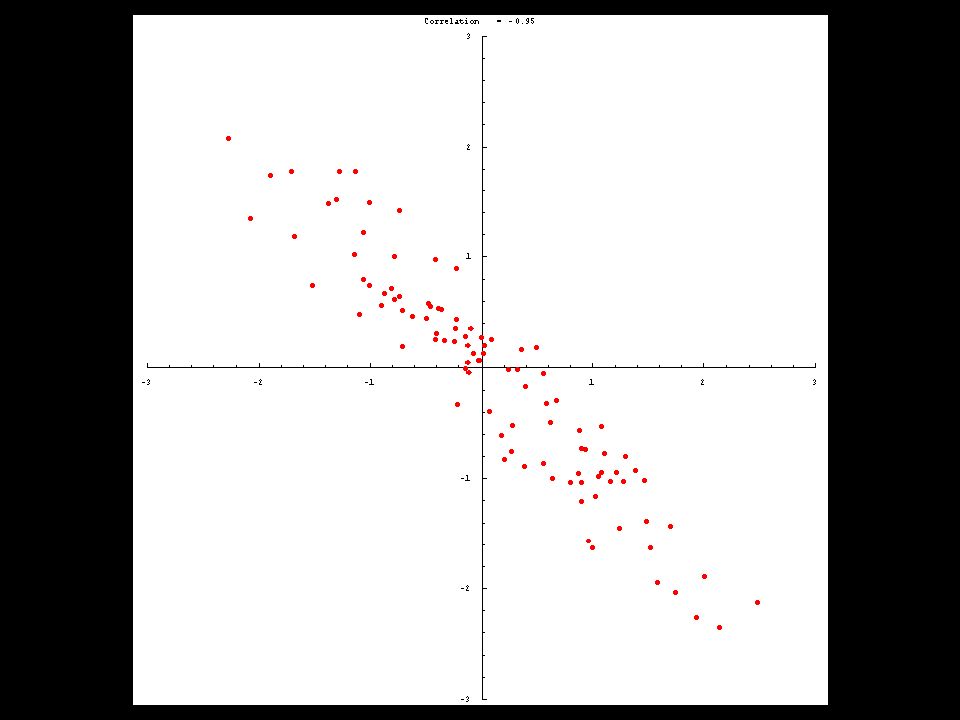
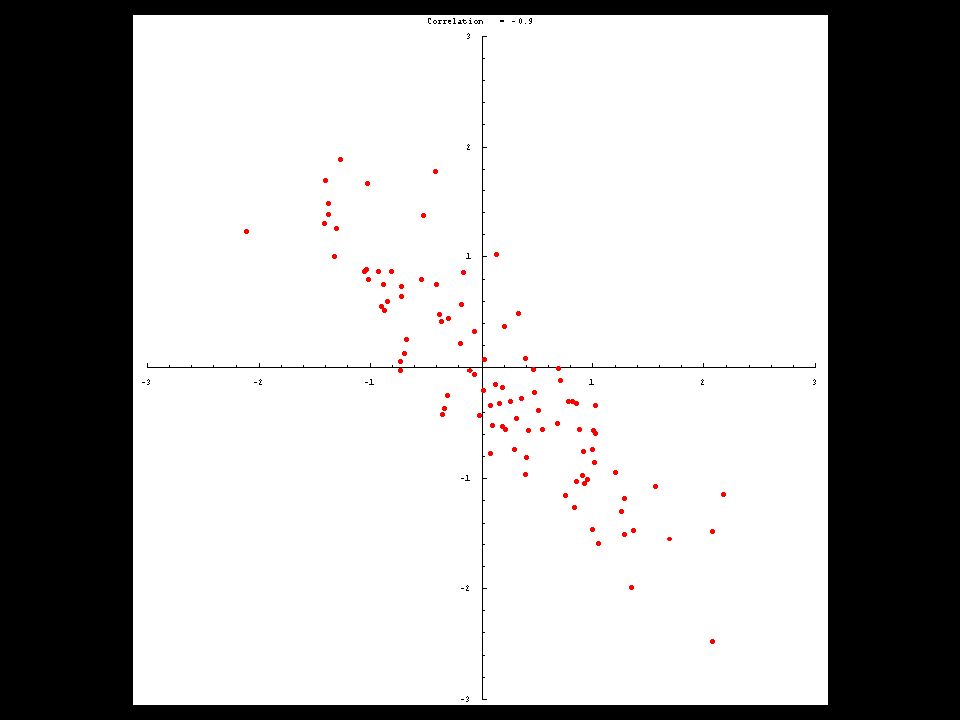
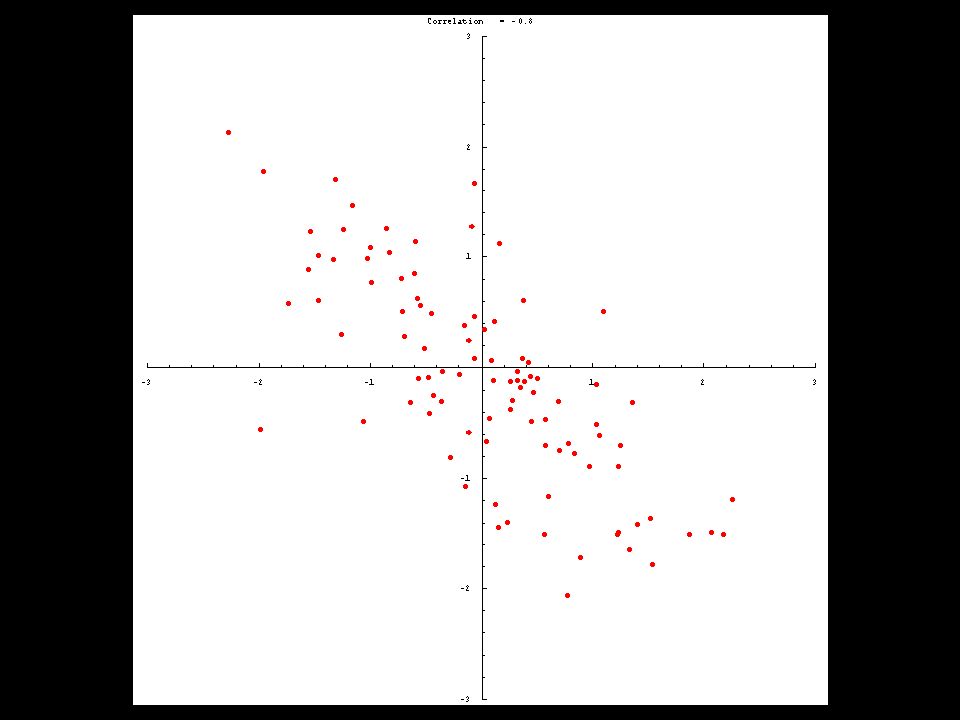
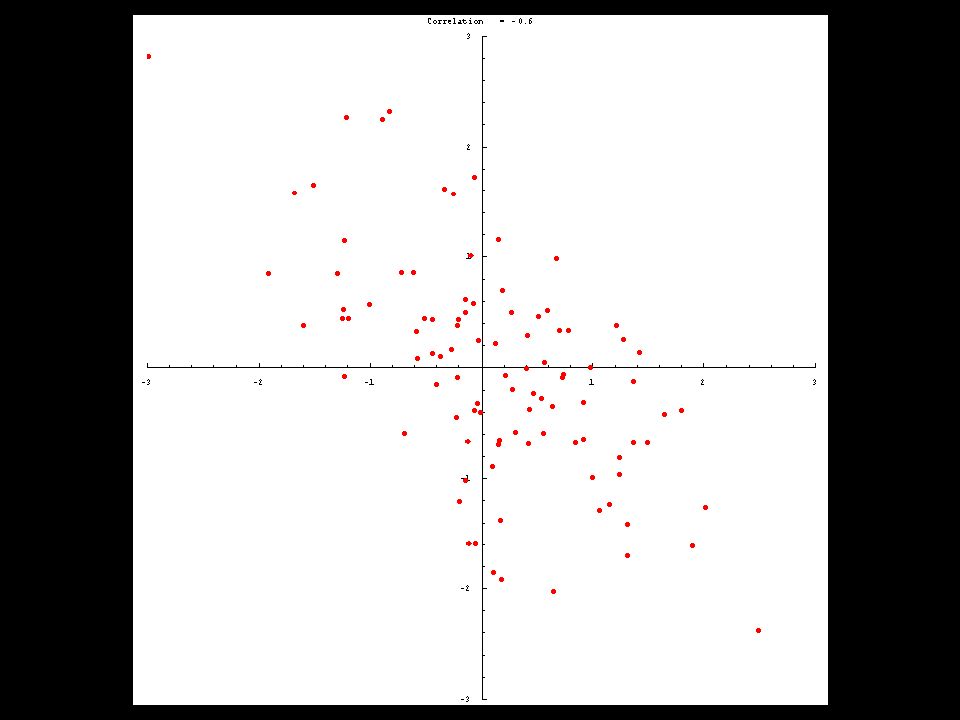
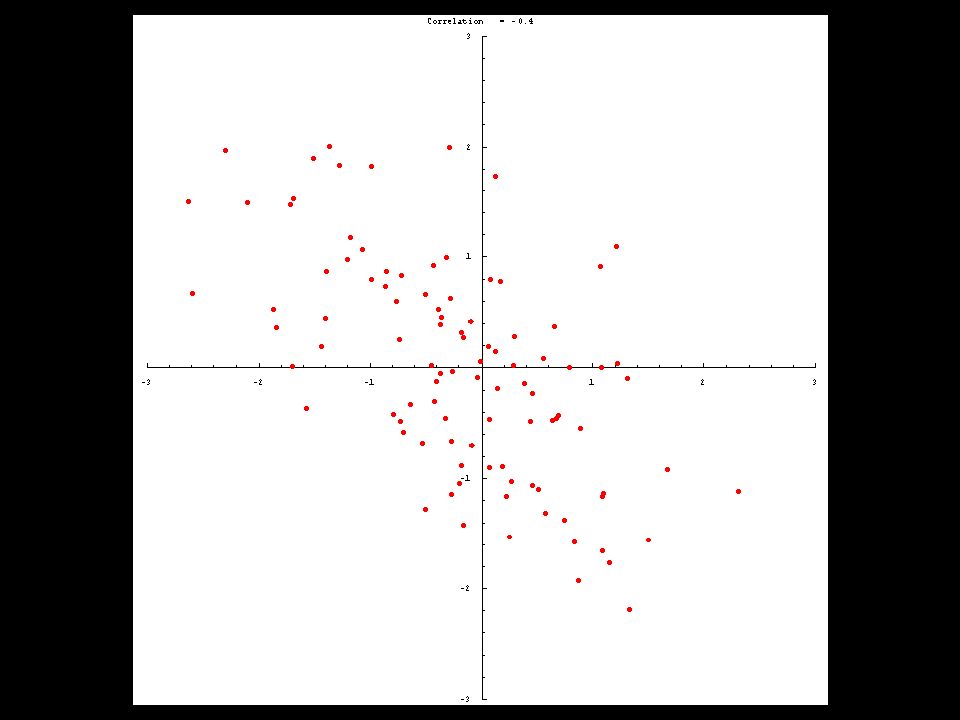
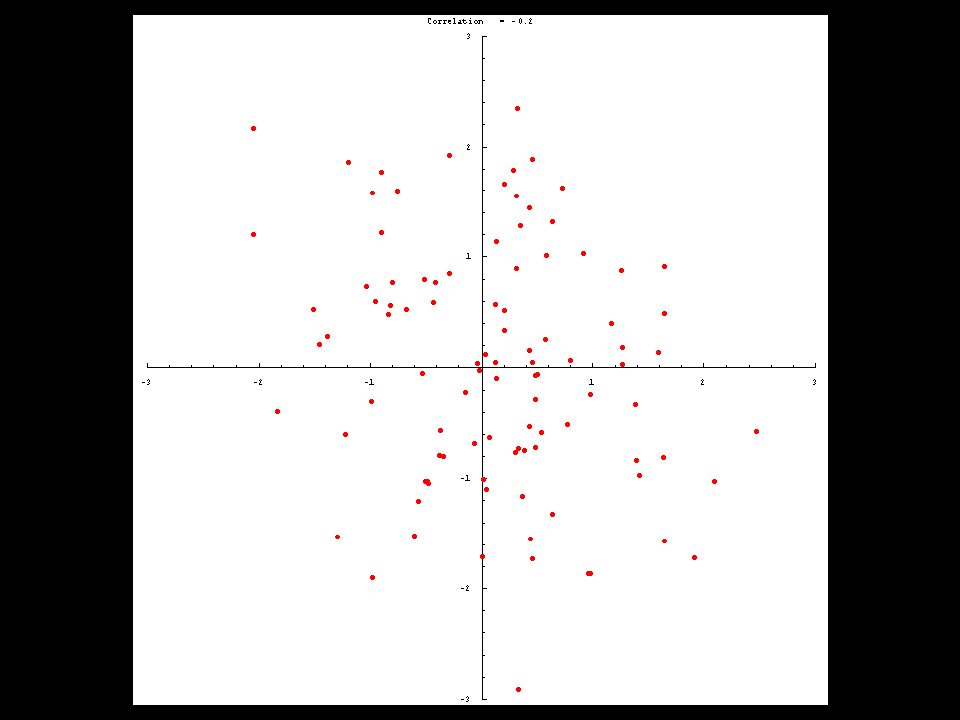
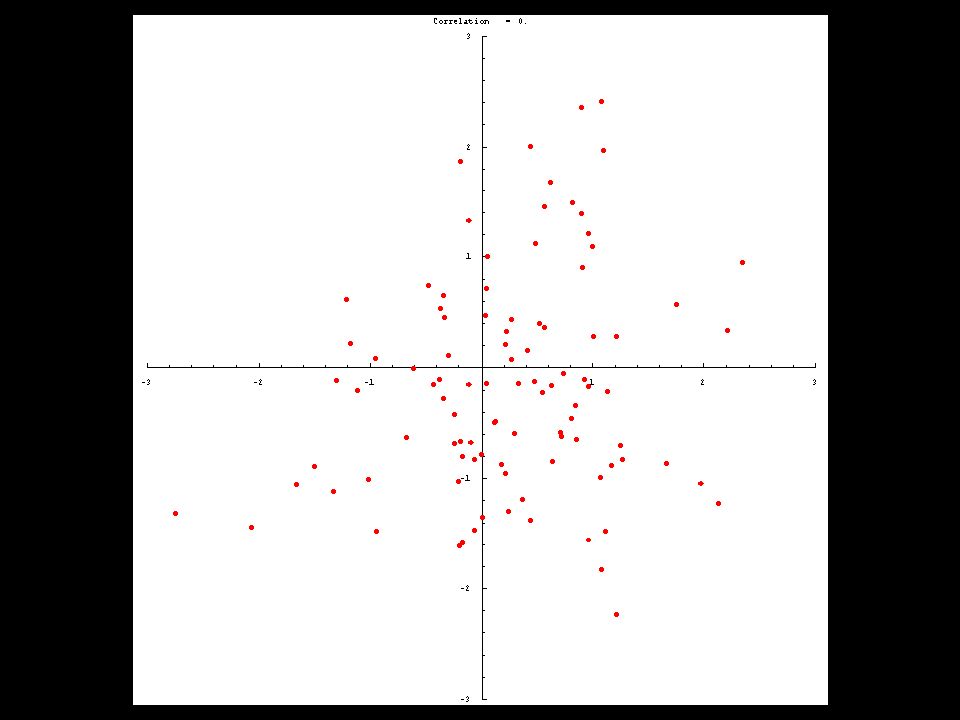
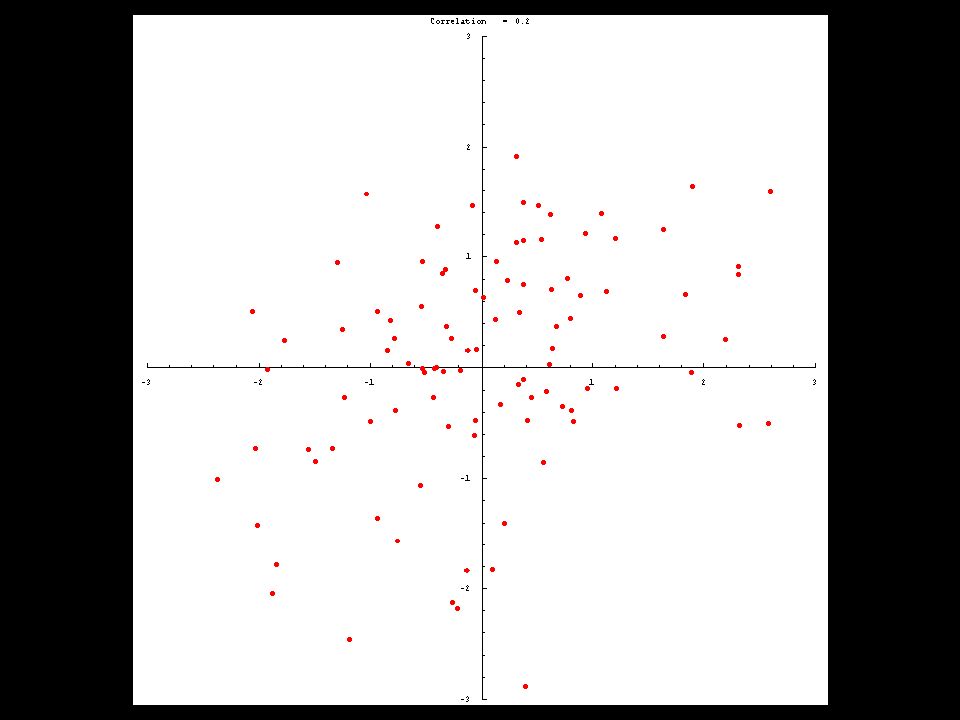
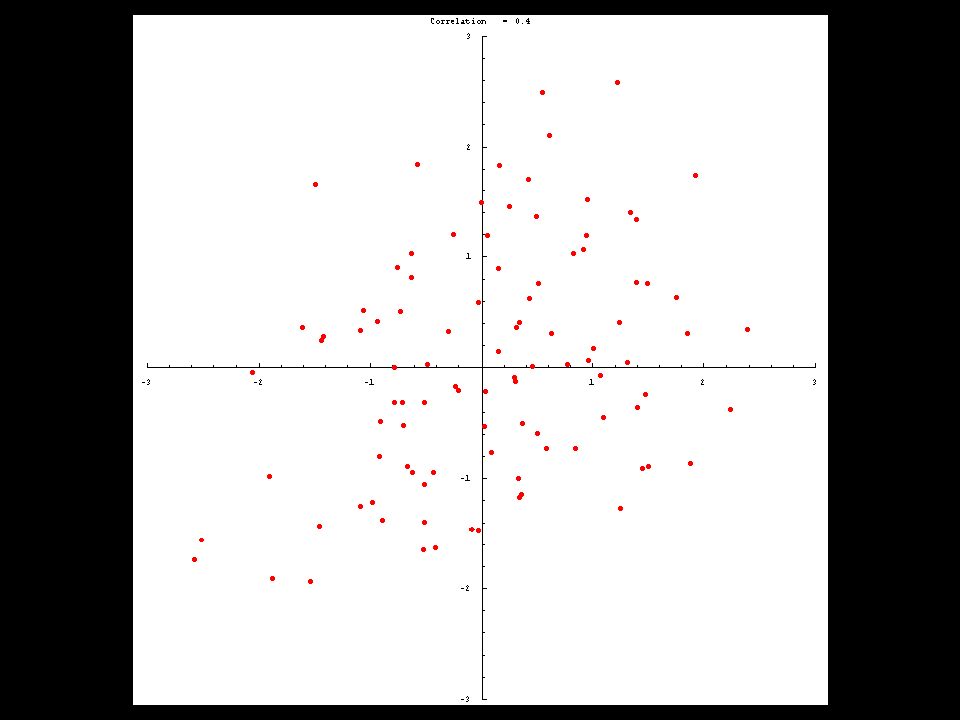
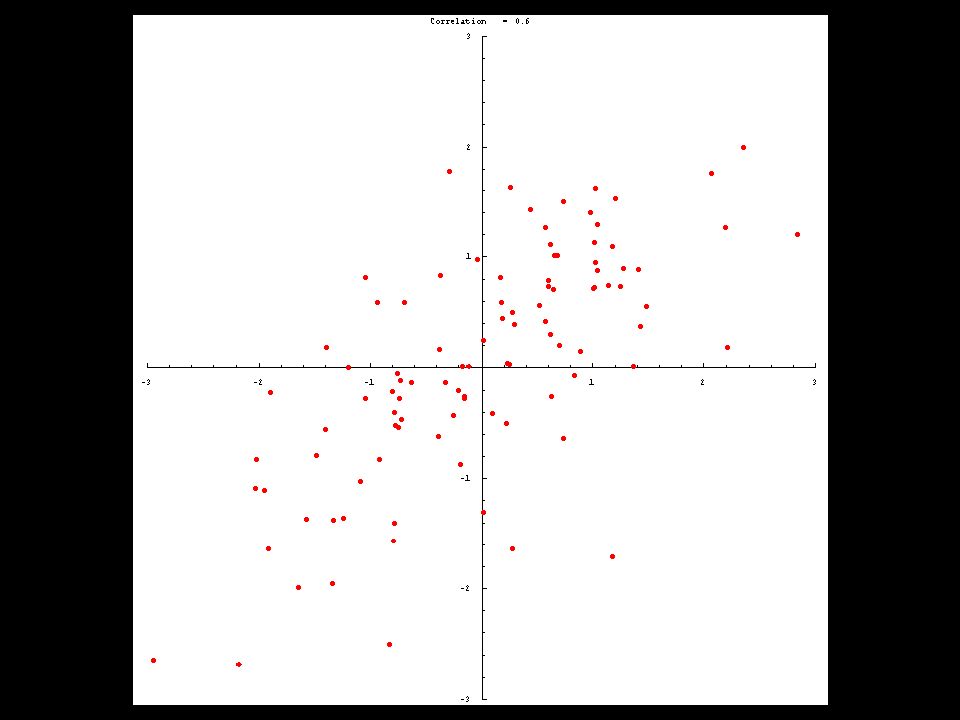
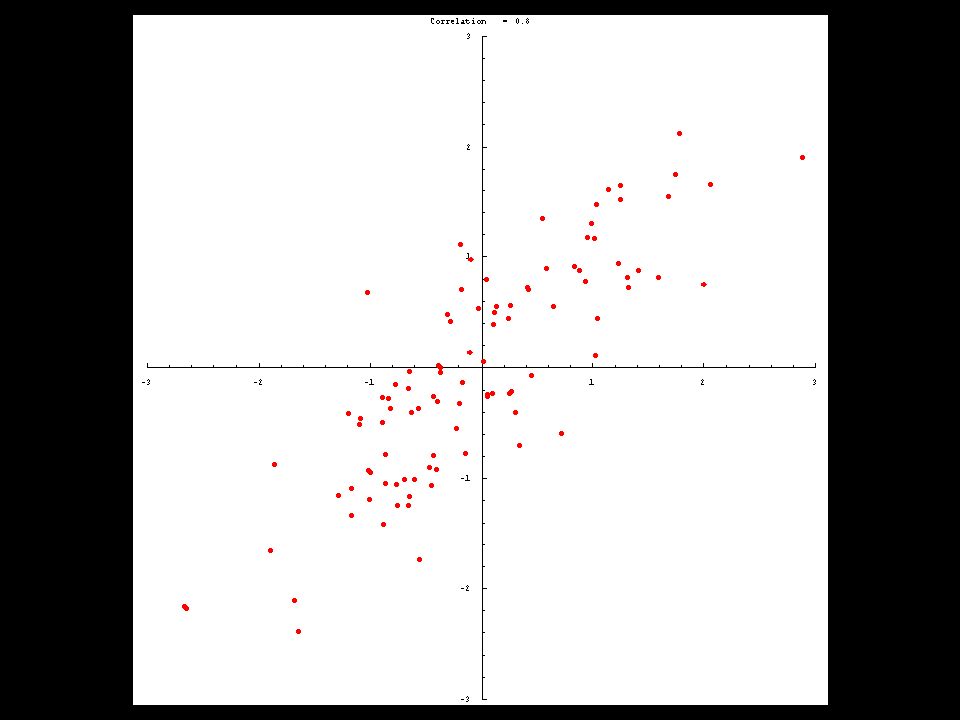
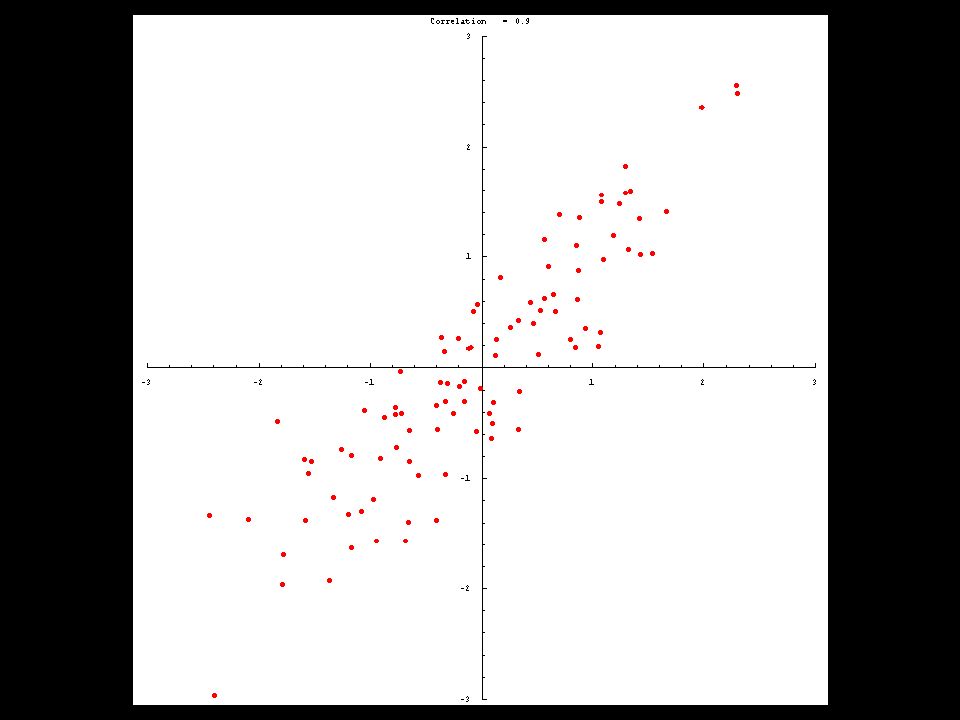
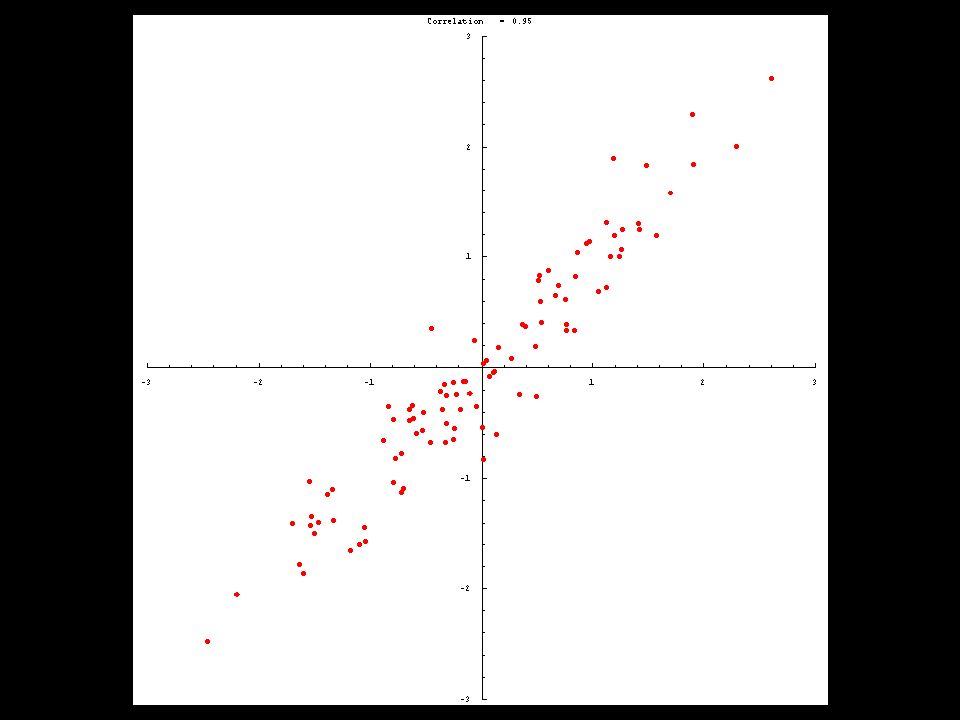
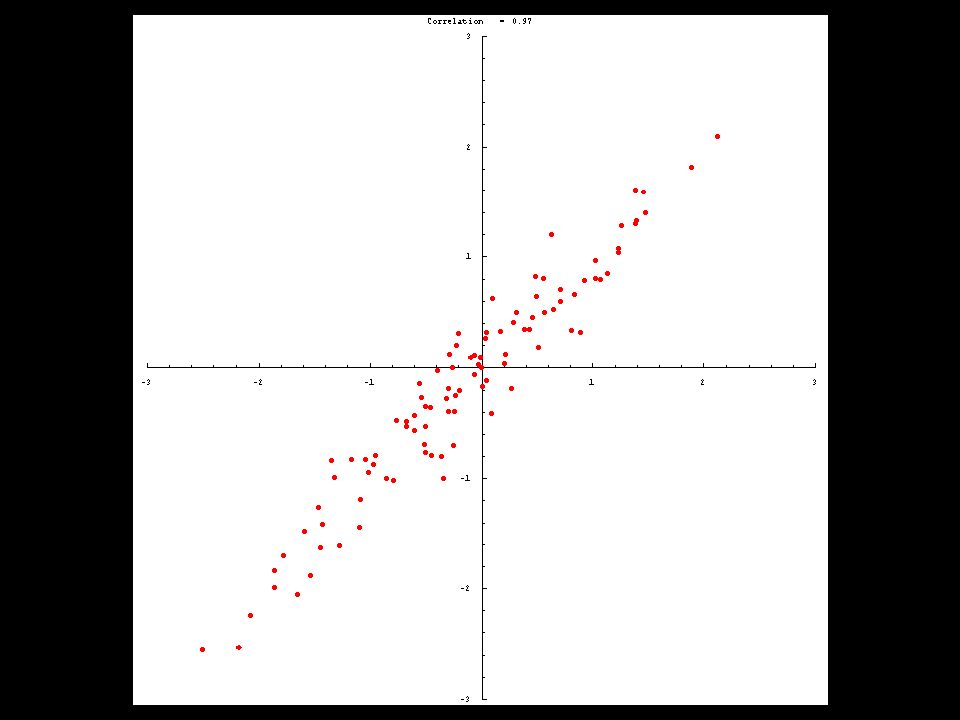
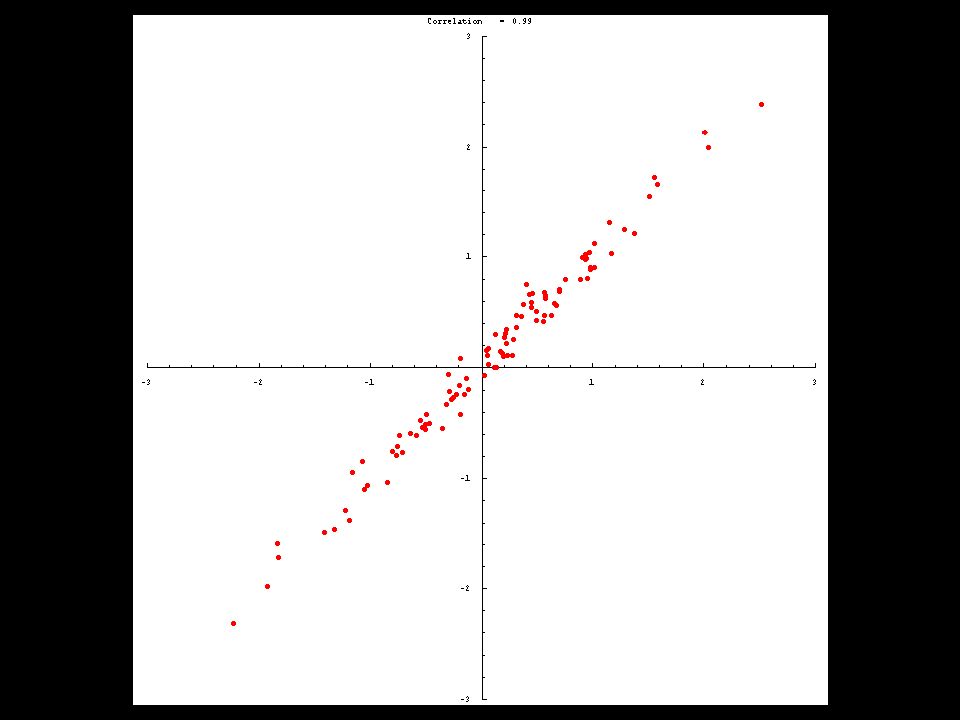
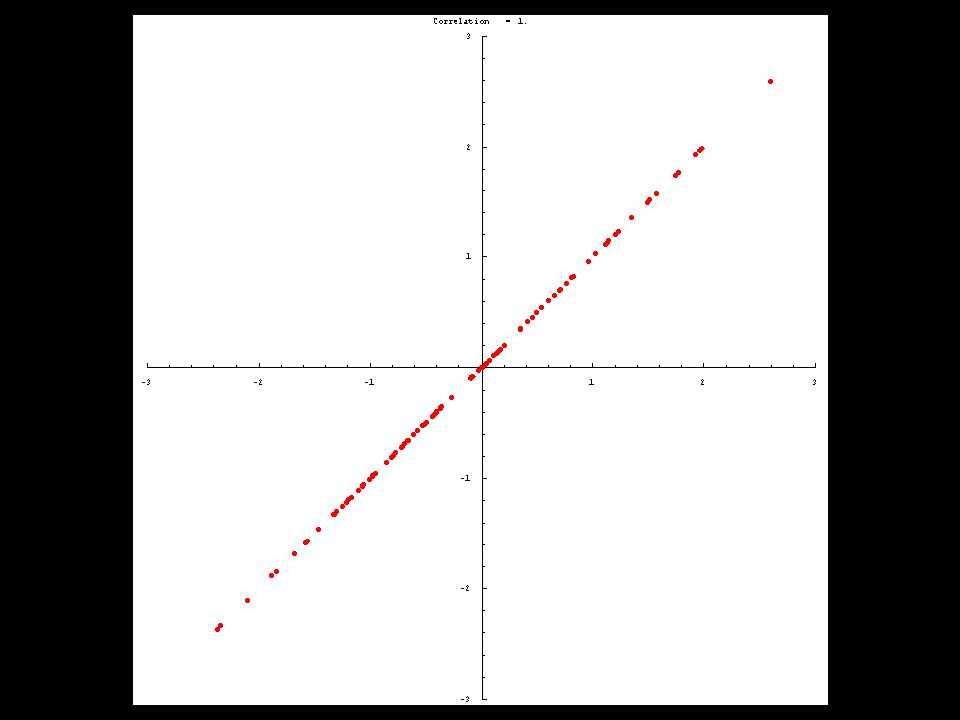
Correlations can be either strong or weak. Also, they can be either positive or negative, as illustrated in the following figures. The correlation coefficient, denoted by r, is a measure of linear association – of clustering around a line. It turns out that r always lies between -1 and 1.

24
Summary: Five numbers quantify the relationship between the two variables: The average of the x-values The SD of the x-values The average of the y-values The SD of the y-values The correlation coefficient, r. In a while we will discuss how to compute r. For now, we will focus on its significance.

25
Note: 1. r = 0.80 does not mean 80% of the points are on the line. 2. r = 0.80 does not indicate twice as much linearity as a scatter plot with r = 0.40

26
Choose from the following options for each of the examples: exactly -1; nearly -1; somewhat negative; close to 0; somewhat positive; nearly 1; exactly 1 Example. If women always married men who were five years older, the correlation between the ages of husbands and wives would be ________________.

27
Choose from the following options for each of the examples: exactly -1; nearly -1; somewhat negative; close to 0; somewhat positive; nearly 1; exactly 1 Example. The correlation between a student’s age and his/her mother’s age is ___________.

28
Choose from the following options for each of the examples: exactly -1; nearly -1; somewhat negative; close to 0; somewhat positive; nearly 1; exactly 1 Example. The correlation between a car’s age and fuel efficiency is _____________.

29
Choose from the following options for each of the examples: exactly -1; nearly -1; somewhat negative; close to 0; somewhat positive; nearly 1; exactly 1 Example. On a 10-question multiple choice test, the correlation between number of correct answers and number of wrong answers is ____________.

30
Choose from the following options for each of the examples: exactly -1; nearly -1; somewhat negative; close to 0; somewhat positive; nearly 1; exactly 1 Example. Darts are thrown at a dartboard. The correlation between the x-coordinate of a dart’s landing and its y-coordinate is ____________.

31
Example. A study finds the following data for the IQs in a population: Husbands: Average = 100,SD = 15 Wives:Average = 100,SD = 15 r = 0.6 Draw a rough, rough sketch of the scatter diagram for this data.

32
The Correlation Coefficient: Computation

33
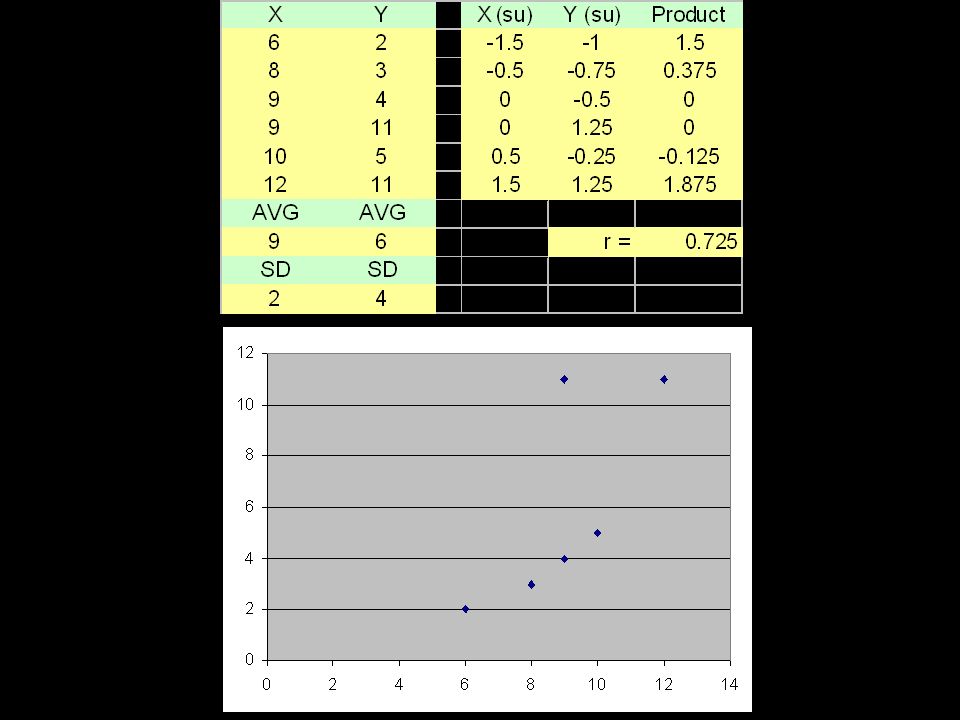
How to compute the correlation coefficient Convert the x-values and y-values into standard units. The average of the products (divide by n - 1, not n, just like with sample standard deviations) is the correlation coefficient.
 is the correlation coefficient..")
35
Excel: =CORREL(A1:A6,B1:B6) To make a scatter plot in Excel 2007: select the data, and on the Insert tab, choose Scatter and click on the picture with only markers. For Excel 2003 or before, see book p. 416

36
Exercise:

37
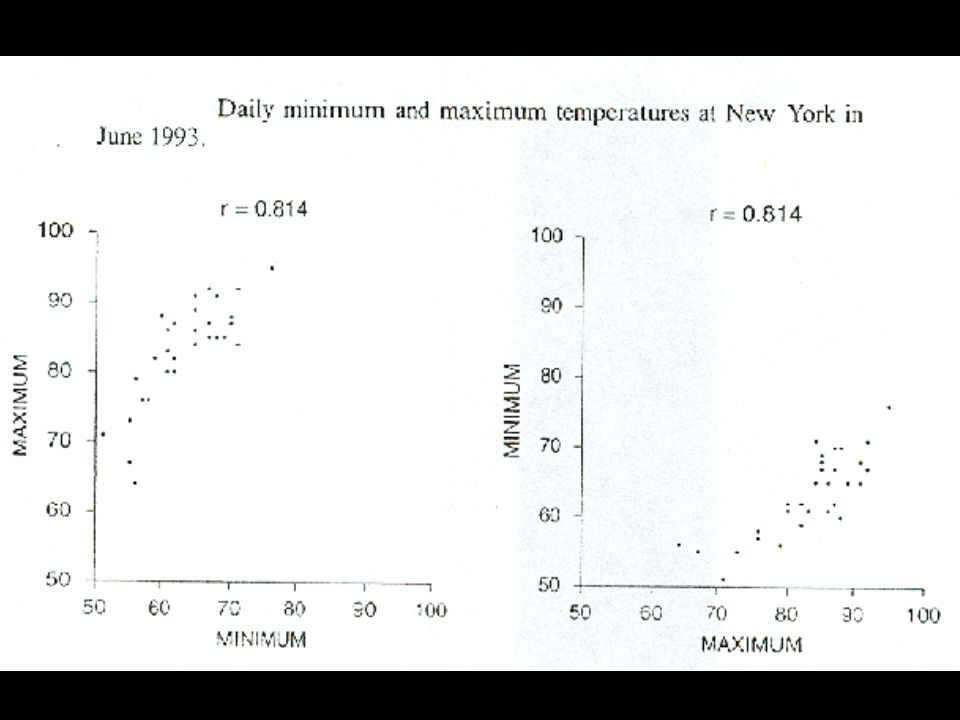
Questions 1.How would we arrange the data so that r was as positive as possible? As negative as possible? 2.Suppose we interchange the x and y columns? Does the correlation coefficient change?

39
Questions 3. Suppose we add 5 to all of the x-values. Does the correlation coefficient change? 4. Suppose we triple all of the y-values. Does the correlation coefficient change?

41
The blue dots were obtained by tripling the x- and y- values of the red dots; the y-values were then increased by 8. Which set has the higher correlation coefficient?

42
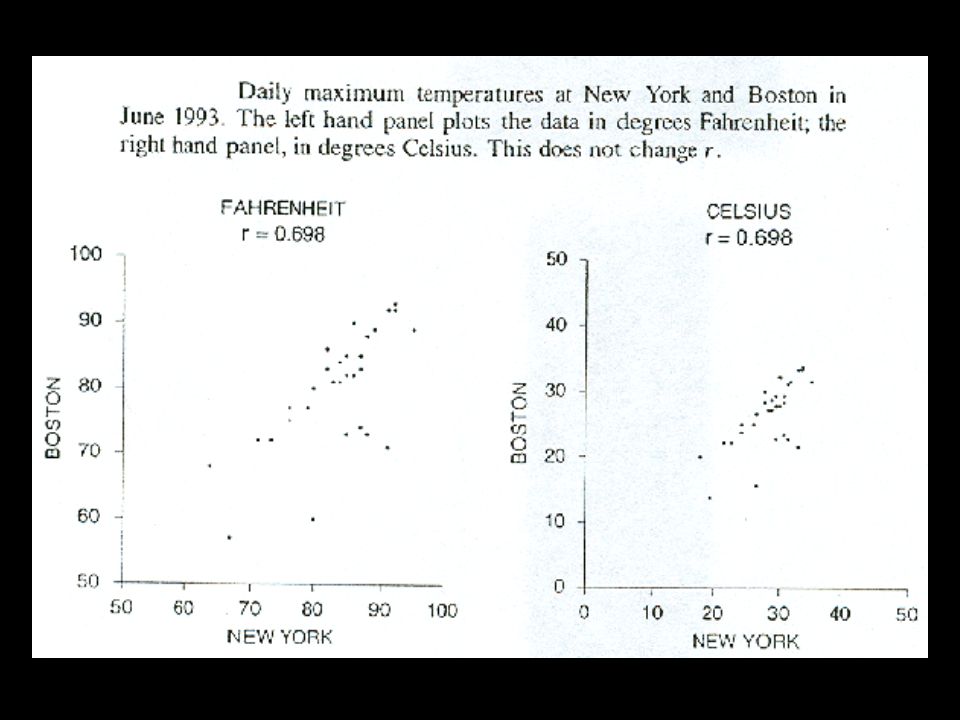
These “changes of scale” do not affect the strength of the association. The association is measured in relative terms, not absolute terms.

43
Find the correlation coefficient of the following five data sets: 77 65 13 21 56 44 32 yx 75 67 56 44 31 23 12 yx 78 57 66 45 14 33 22 yx 147 106 125 84 23 62 41 yx 156 215 184 123 32 91 60 yx 57 76 65 44 13 32 21 yx 77 56 65 44 13 32 21 yx r = 6 / 7 r = 11 / 14

Similar presentations
 are related (i.e. correlated). That is, how much they depend on each other. Section 10.2 Correlation.>")


 –American.>")


