Download presentation
Presentation is loading. Please wait.

1
Portfolio Analysis AGEC 489/689 Spring 2009 Slide Show #13

2
Reading the Road Signs in Agricultural Lending

3
Some Signs Are Confusing…

4
Some are Hard to Read...

5
What we saw when things become clear over time

6
Portfolio Analysis

7
Externalities Affecting Portfolio Performance…. Macroeconomic policy Farm program policy Trade policy Weather and disease Ability to pay in client nations Competitor nation actions

8
Macroeconomic Conditions Expensive imports (bad for Ag!) Gains in productivity (great for Ag!) Expensive fuel (bad for Ag!) Rising inflation (bad for Ag!) Low interest rates (great for Ag!) Low unemployment (great for Ag!) Strong stock market (great for Ag!) Federal budget deficits (bad for Ag!)
 Gains in productivity (great for Ag!) Expensive fuel (bad for Ag!) Rising inflation (bad for Ag!) Low interest rates (great for Ag!) Low unemployment (great for Ag!) Strong stock market (great for Ag!) Federal budget deficits (bad for Ag!)")
9
What Could Go Wrong? Federal budget deficits rise Global economic trends, higher crude prices lead to rising inflationary pressures. Eventual higher interest rates and higher input prices passed along to farmers. Higher interest rates, higher input prices offset by high farm commodity prices, otherwise collateral values will fall.

10
Can You Assess the Impact of the Following Events… What if the country’s central bank adopts a tighter monetary policy? What if we see a 20 percent increase in crude oil prices? What if exchange rates rise with client nations rise?

11
Impact of these events on.. Farm commodity prices Farm input prices Interest rates Net farm income Land prices and other asset values Off-farm income Debt repayment capacity

12
What is Stress Testing? Ad Hoc stress testing What is it? Strengths and weaknesses Systematic event stress testing What is it? Strengths and weaknesses

13
Ad Hoc Stress Testing? Assume future revenue based upon past prices, costs and yields changes by a certain percent. Assume percent cut in income, land values, etc. One year focus. Easy to do.

14
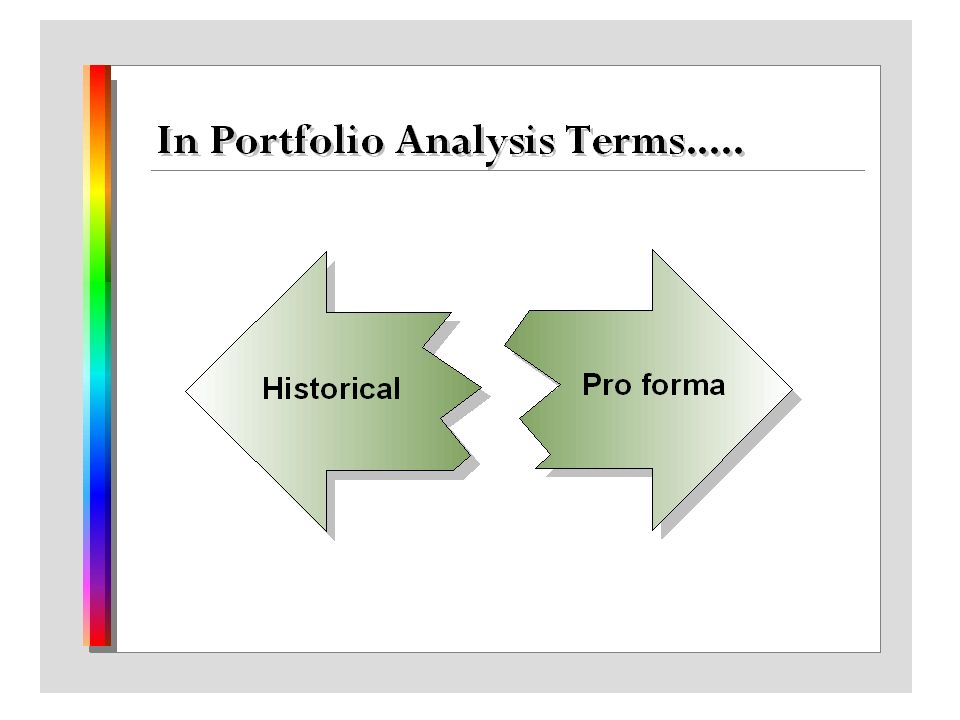
Event Stress Testing? Pro forma analysis Impact of future events: Farm policy Macroeconomic policy Events in client nations Competitor nation actions Looking down the road

15
What are the differences? Ad Hoc Stress Testing Assume a change commodity prices Assume a change in input prices Assume a change in land values Assume a change in wages and salaries Ad Hoc Stress Testing

16
What are the differences? Ad Hoc Stress Testing Assume a change commodity prices Assume a change in input prices Assume a change in land values Assume a change in wages and salaries Event Stress Testing Use projections from econometric models that have significant probability of actually occurring Can address “What if” questions associated with potential events Ad Hoc Stress Testing Event Stress Testing

17
PAST PRESENT Rear View Mirror Rear View Mirror

18
PASTFUTURE PRESENT l Historical analysis l Comparative analysis l Credit scoring models l Ad hoc stress testing

19
PASTFUTURE PRESENT Rear View Mirror Rear View Mirror Windshield

20
PASTFUTURE PRESENT l Historical analysis l Comparative analysis l Credit scoring models l Ad hoc stress testing l Pro forma analysis of “likely” trends over time FUTURE

21
PASTFUTURE PRESENT l Historical analysis l Comparative analysis l Credit scoring models l Ad hoc stress testing l Pro forma analysis of “likely” trends over time l Event stress testing designed to address key “What if” questions FUTURE

23
Why Event Stress Testing? Tied to specific events that have a reasonable likelihood of occurring. Management can respond to likely events rather than hypotheticals!!! Consistent accounting of impact on all economic variables. Looking beyond the current year when assessing term debt repayment capacity.

24
What to Watch For... Nature of global economic bounce and what this means: Agricultural export demand Cost of imports Central bank reactions to any buildup in inflationary expectations. Rising input costs as suppliers pass on their costs to producers.

25
A Portfolio Analysis Model

26
Purpose of Modeling Assess portfolio’s performance at the segment level. Identify problem loans within that segment. Develop benchmarks for use in evaluating new loan requests and performance of existing borrowers against the benchmark.

29
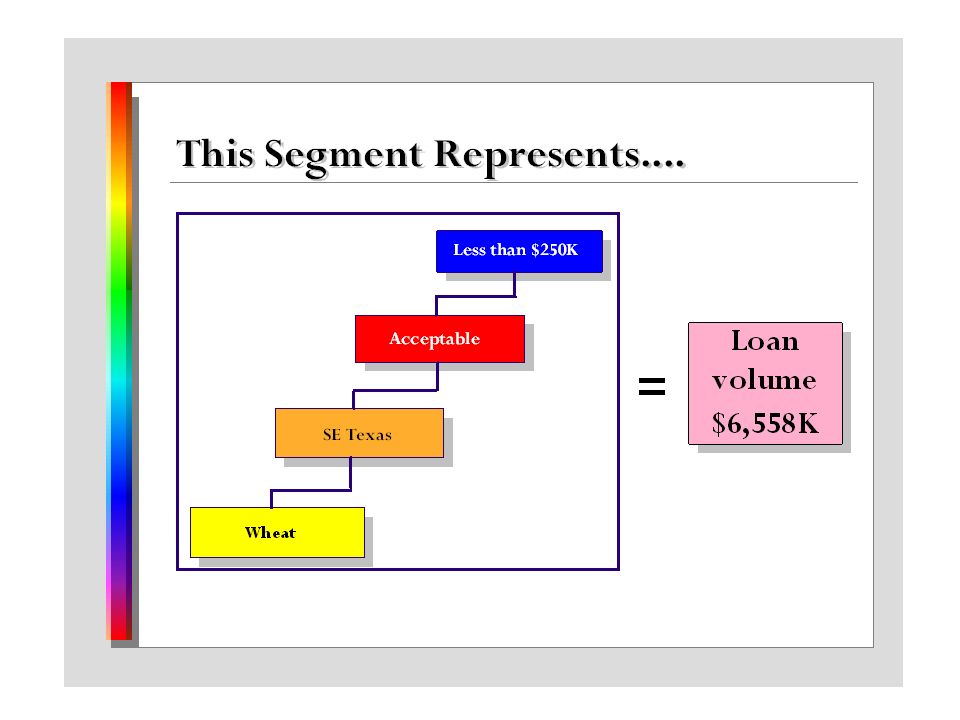
Building segments representing specific groups of accounts in the agricultural loan portfolio Building segments representing specific groups of accounts in the agricultural loan portfolio Choice of crop yield shocks Setting loan quality indicators for liquidity, solvency and debt repayment capacity Setting loan quality indicators for liquidity, solvency and debt repayment capacity Designing and running of new scenario Bringing up the results screen to view results of scenario Bringing up the results screen to view results of scenario

30
Design of Multiple Criteria Segment Design of Multiple Criteria Segment

31
Cutoffs for Indicators of Liquidity, Solvency and Debt Repayment Capacity Cutoffs for Indicators of Liquidity, Solvency and Debt Repayment Capacity Maximum Ratio of Carryover Debt-to-Equity: set by user Maximum Ratio of Carryover Debt-to-Equity: set by user Searching for those loans that do not meet these standards…

32
Simulation done in 2000 Focus on one primary commodity…cotton

33
Loan quality indicators settings Loan quality indicators settings An account falling below lender set indicator levels An account falling below lender set indicator levels

34
Farm Credit System Loan Classification The goal of the portfolio manager and credit officers is to make loans that grade out as “acceptable”, or exceed credit standards. All other classes require additional attention by the credit officer making the loan to determine reasons for weak performance and assess prospects for improvement.

35
Portfolio Analysis Process

Similar presentations


 Macroeconomic Policy* Exchange rates and inflation Monetary and.>")


