Download presentation
Presentation is loading. Please wait.

1
3.2 Introduction to Development

2
Economic Growth vs. Development Growth Growth Increase in national income (1 yr.) Increase in national income (1 yr.) Quantitative Quantitative Development Development Increase in national income + Increase in national income + Reduction of (or increase in Living Standards) Reduction of (or increase in Living Standards) poverty poverty Income inequality Income inequality Unemployment Unemployment Qualitative (normative) Qualitative (normative) Social Dimension Social Dimension Is growth “trickling down” to the poorest? Is growth “trickling down” to the poorest?
 Increase in national income (1 yr.) Quantitative Quantitative Development Development Increase in national income + Increase in national income + Reduction of (or increase in Living Standards) Reduction of (or increase in Living Standards) poverty poverty Income inequality Income inequality Unemployment Unemployment Qualitative (normative) Qualitative (normative) Social Dimension Social Dimension Is growth trickling down to the poorest. Is growth trickling down to the poorest .")
3
Growth is prerequisite for development Growth is prerequisite for development Positive correlation Positive correlation

4
GDP vs. GNP As Measures of Growth Must be Must be in “real” terms (adjusts for inflation) in “real” terms (adjusts for inflation) Per capita (adjusts for pop.) Per capita (adjusts for pop.) Which is the better measure for comparing countries? Which is the better measure for comparing countries?
 in real terms (adjusts for inflation) Per capita (adjusts for pop.) Per capita (adjusts for pop.) Which is the better measure for comparing countries. Which is the better measure for comparing countries .")
5
Advantages of GDP Living standards tied closer to domestic factors Living standards tied closer to domestic factors Unemployment linked to GDP Unemployment linked to GDP GDP easier to compare among countries GDP easier to compare among countries Only domestic factors considered (apples to apples) Only domestic factors considered (apples to apples) Not helpful to compare U.S. GNP with Irelands Not helpful to compare U.S. GNP with Irelands Productivity closer link to domestic culture and policies Productivity closer link to domestic culture and policies

6
Limitations of GDP Does not account for: Does not account for: Environmental impacts Environmental impacts Wealth distribution Wealth distribution Buying power of pop. Buying power of pop. General welfare in society General welfare in society

7
Limitations of GDP (cont.) Comparison in a single country over time Comparison in a single country over time Pop. And inflation Pop. And inflation Quality and Substitution Bias Quality and Substitution Bias Over-Time basket of goods changes (aggregate demand) Over-Time basket of goods changes (aggregate demand) Substitution to superior goods Substitution to superior goods Overestimation of inflation Overestimation of inflation New goods (less economies of scale New goods (less economies of scale Increase in Quality not factored Increase in Quality not factored Accounting Errors Accounting Errors Different countries Different countries Newer methods Newer methods
 Over-Time basket of goods changes (aggregate demand) Substitution to superior goods Substitution to superior goods Overestimation of inflation Overestimation of inflation New goods (less economies of scale New goods (less economies of scale Increase in Quality not factored Increase in Quality not factored Accounting Errors Accounting Errors Different countries Different countries Newer methods Newer methods.")
8
Comparing GDP Between Countries More Weaknesses More Weaknesses Composition of Output: Doesn’t account for what is being produced. “Guns or Butter”? Composition of Output: Doesn’t account for what is being produced. “Guns or Butter”? Composition of Expenditure: Composition of Expenditure: What is being consumed? What is being consumed? Distribution of Income: Distribution of Income: U.S. top 10% of earners = 31% of national income U.S. top 10% of earners = 31% of national income Norway top 10%= 22% Norway top 10%= 22%

9
Unaccounted for Activity: Unaccounted for Activity: LDCs: Black Markets, Barter economy LDCs: Black Markets, Barter economy MDC: Tax Evasion, labor law evasion MDC: Tax Evasion, labor law evasion Exchange Rate Distortions Exchange Rate Distortions Externalities and Environmental Damage Externalities and Environmental Damage

10
Purchasing Power Parity (PPP) Comparing exchange rates inadequate Comparing exchange rates inadequate PPP- compares amount that can actually be bought (purchasing power) between different countries PPP- compares amount that can actually be bought (purchasing power) between different countries “Basket” of goods compared “Basket” of goods compared Trends when considering PPP: Trends when considering PPP: MDCs = GDP overestimated MDCs = GDP overestimated LDCs = GDP underestimated LDCs = GDP underestimated See pgs. 336-337 See pgs. 336-337

11
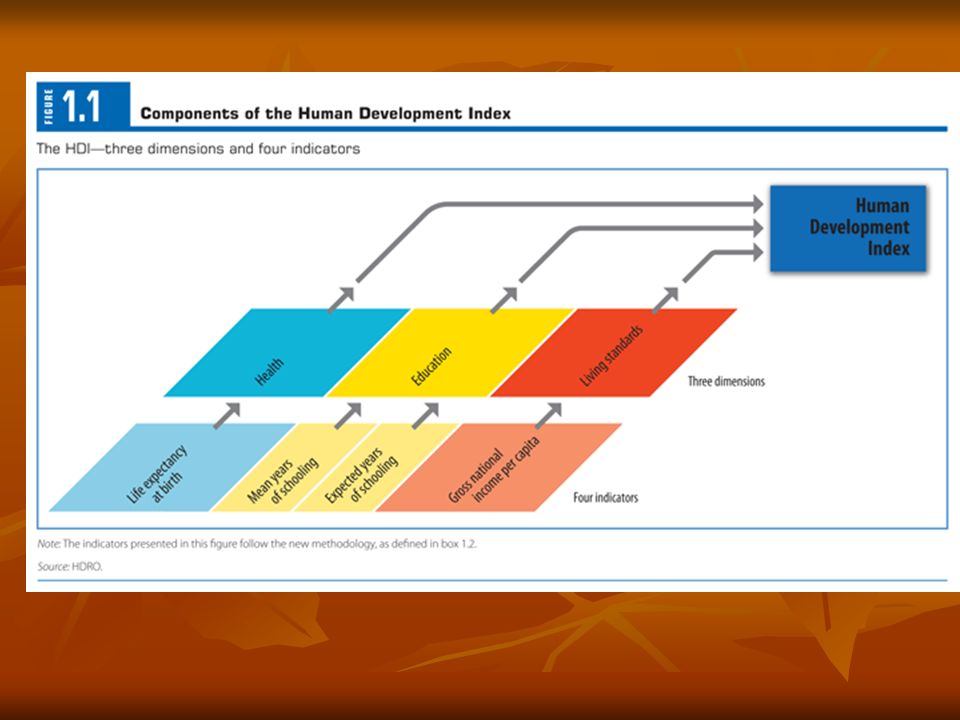
Human Development Index Ranking of countries degree of development Ranking of countries degree of development 3 Variables 3 Variables Life expectancy at birth Life expectancy at birth Adult literacy with education enrollment Adult literacy with education enrollment GDP per capita GDP per capita Composite Index = 1.00 (highest possible) Composite Index = 1.00 (highest possible) Humand Development Index Link Humand Development Index Link Humand Development Index Link Humand Development Index Link
 Composite Index = 1.00 (highest possible) Humand Development Index Link Humand Development Index Link Humand Development Index Link Humand Development Index Link")
Similar presentations

 “By the problem of development I mean simply the problem of accounting for the observed pattern, across countries and across time, in levels.>")

 Economic development involves many outcomes: –Income growth (Chs 2 & 6), poverty (3),>")


