Download presentation
Presentation is loading. Please wait.

1
2. Changes in employment structures over time
The relative importance of the primary, secondary and tertiary sectors in countries at different levels of development; change over time and space.

2
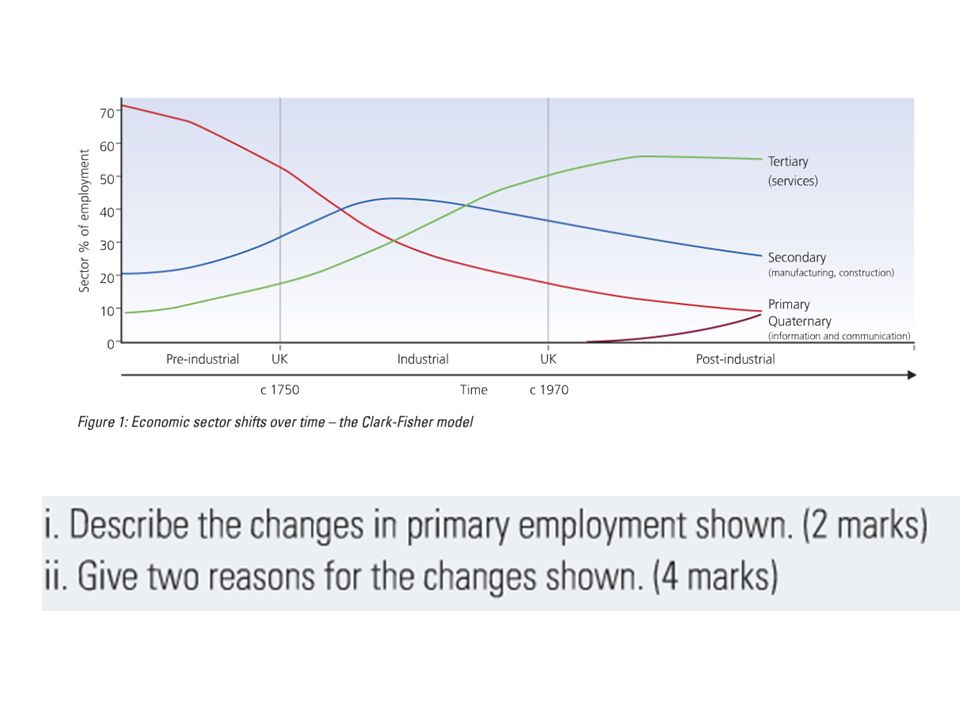
Line graph to show the UK employment structure from 1800 – 2000
The Clark Fisher model Line graph to show the UK employment structure from 1800 – 2000

3
Key term

4
The sectors change with time over three phases as the Clark-Fisher model shows:
The pre-industrial phase- the primary sector leads the economy and may employ more than two-thirds of the working population. Agriculture is the most important activity. The industrial phase- the secondary and tertiary sectors increase in importance. The primary sector declines. The post-industrial phase- As the tertiary sector becomes the most important sector, the secondary sector declines and the primary sector employs a small percentage of the active population.

5
In an LIC, such as Mali, a high proportion of the active population works in primary industries, especially in farming. This type of country is in the pre-industrial phase. China is an NIC and has a strong manufacturing sector. It is in the industrial phase. HICs, such as Germany, are in the post-industrial phase.

6
Using page 156-157 Geography A Foundations
How do employment patterns change over time?

7
Key term

9
Skills practice

Similar presentations


 and social (human). Economic.>")


, Pg 25 1. a) Possible Answers: At the early stages of its development, a country is likely.>")