Download presentation
Presentation is loading. Please wait.

1
Presented By: Jeff Andrews Adrian Simon Jon Brownlow

2
Objective: increase fuel economy and reduce engine wear Requirements: 0.75 OD ratio, compact design Components sourced from a Ford A4LD transmission Individual components analyzed during design

3
Case and endplates were cast out of aluminum Pan welded from rectangular plates Remaining components machined

4
Static Testing: Used to verify performance and structural integrity Torsional test on case at design conditions (350 ft-lb) Band holding strength Band and clutch slip conditions at different line pressures Dynamic Testing: Use the dynamometer in the lab to quantify overdriving efficiency and power loss
 Band holding strength Band and clutch slip conditions at different line pressures Dynamic Testing: Use the dynamometer in the lab to quantify overdriving efficiency and power loss")
5
Original test design was on work surface Re-evaluated test design Built plate to hold overdrive Suspended case to simulate it being installed in a vehicle

6
Test setup prior to static loading

8
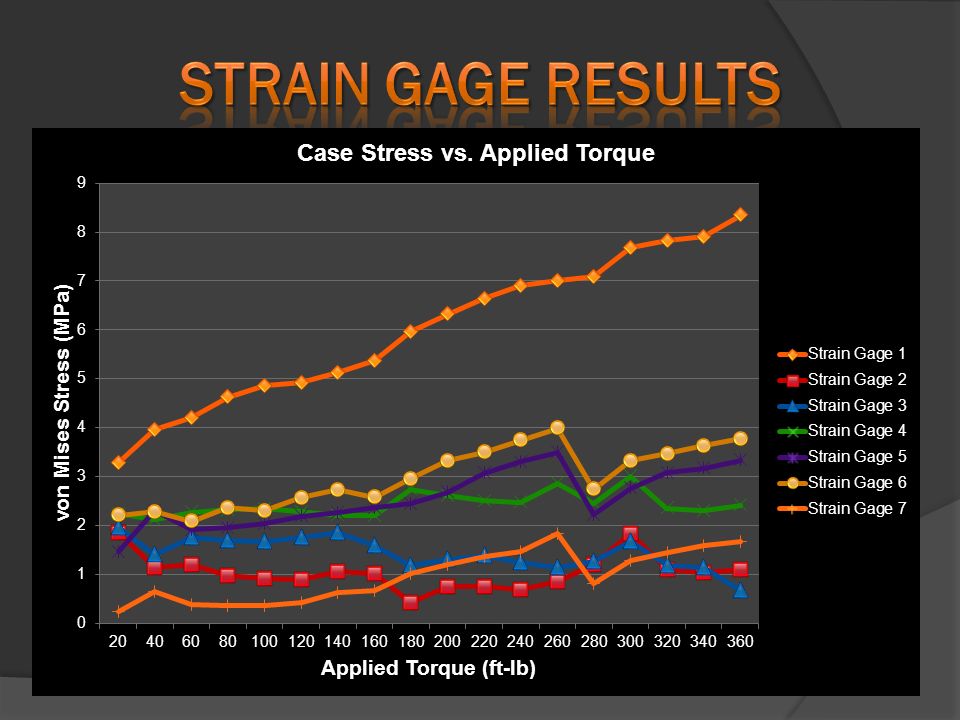
Strain gage test results were similar to FEA models FEA safety factor (6061-T4 Al): 11.6 Experimental safety factor (6061-T0 Al): 6.62 Experimental safety factor (6061-T4 Al): 13.7 Strain Gage 1
: 11.6 Experimental safety factor (6061-T0 Al): 6.62 Experimental safety factor (6061-T4 Al): 13.7 Strain Gage 1")
9
General Equations: The band clutch is used to the hold drum stationary One end fixed while other end is attached to a lever arm When force is applied to the lever arm, the band wraps around the drum and locks it in place

11
Exploded view of the drum and clutch pack system. Cutaway view of the overdrive illustrating its internal components.

12
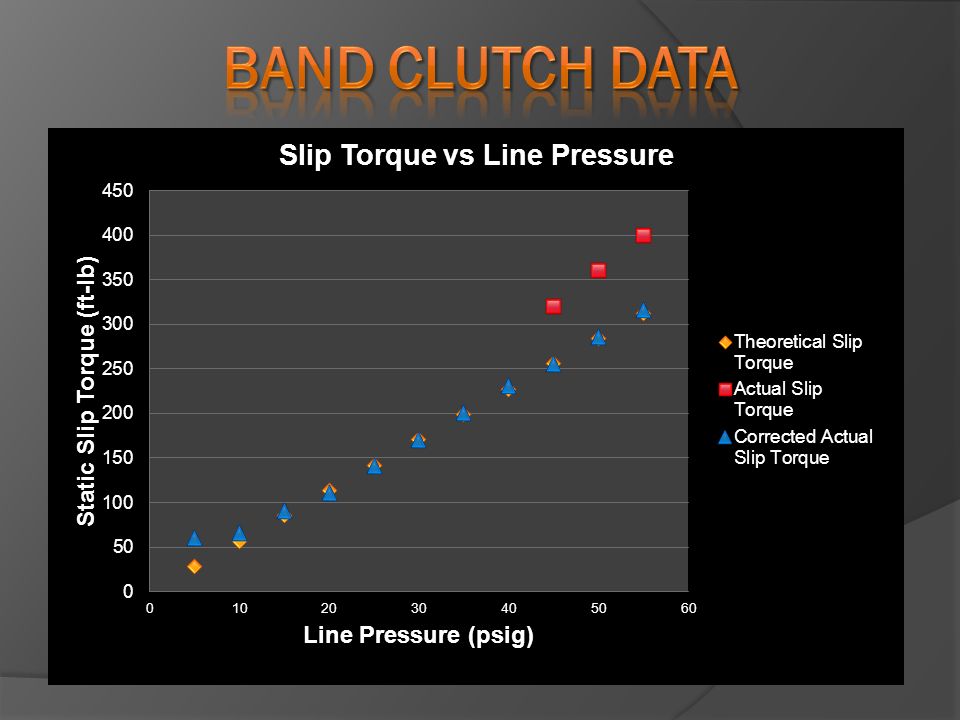
psislip (ft-lb)μ 5-- 1080.07364 15-- 2090.04142 2580.02946 31800.23756 35900.23671 40900.20712 45950.19434 501100.20252 551200.20084 601500.23013 651700.24076 701900.24986 751900.2332 802100.24164 852250.24367 902550.26082 953230.31298 1023740.33753
μ")
13
Relation between torque and hydraulic pressure showing the minimum coefficient of friction required to relate the two properties.

14
To maximize fuel economy, the overdrive must have minimal frictional losses A dynamometer (or “dyno” for short) is a device that measures force, torque or power. The dyno being used records angular velocity and torque Equation: CSUS Water brake Dynamometer

15
The dyno produced an unexpectedly large amount of internal resistance. Four different motors had to be used to power the system. No quantitative results could be obtained from the dyno, since the majority of motors used were underpowered along with other constraints.

16
A separate test was performed with a ¾ hp electric motor coupled solely to the overdrive. The horsepower lost through the overdrive was calculated from the rpm differences between motor coupled to the overdrive and it free spinning, since the electric motor provided a constant amount of torque through all rpm ranges.

17
The efficiency of the overdrive was calculated to be 80% This is a typical efficiency rating of a gearbox. The Simulink model for the overall system estimates the overall fuel economy gained by use of the overdrive at highway speeds to be approximately 5 MPG. http://www.gas-mileage-tips.com/images/better-gas-mileage-2.jpg

Similar presentations


>")


 of two surfaces. Section 2 F Applied Force, F Friction Force, F f.>")


