Download presentation
Presentation is loading. Please wait.

1
1.6 Mean, Median, Mode

2
1.6 – Mean, Median, Mode To organize and summarize data we use Mean, Median, and Mode. These are called Measures of Central Tendencies. They measure where the “center” might be.

3
1.6 – Mean, Median, Mode Mean (average) = sum of the data items
total number of items Median – If you put the number in order, the median is the middle number. If there are an odd number of items, take the mean of the middle two numbers. Mode – the number that appears the most times. You can have 0, 1, or more modes.

4
1.6 – Mean, Median, Mode Example – Find the mean, median and mode of the following. 14, 10, 2, 13, 16, 3, 12, 11 Mean = Median = Mode =

5
1.6 – Mean, Median, Mode ALGEBRA REVIEW:
How would you solve the following?

6
1.6 – Mean, Median, Mode Example – Suppose your grades on three math tests were 82, 94, and 89. What grade do you need on your next test to have an average of 90?

7
1.6 – Mean, Median, Mode The range of a set of data is the difference between the greatest and least data values. The range gives a measure of spread or how far apart the data are.

8
1.6 – Mean, Median, Mode Example – Finding the range
Find the range of the following:

9
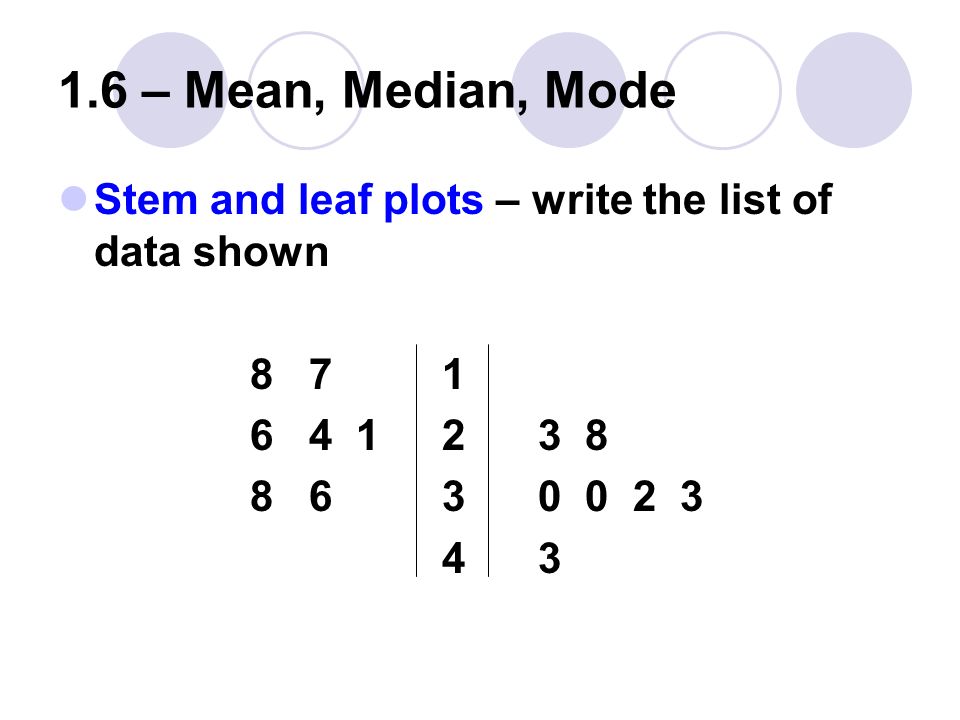
1.6 – Mean, Median, Mode Stem and leaf plots – write the list of data shown 4 3
Similar presentations

First, order the numbers from least to greatest. 2)Next, add the numbers in the data set. 3)Then,>")


 2.Find the sum of all the numbers in the set. a+b+….+z= Total 3. Count.>")


