Download presentation
Presentation is loading. Please wait.

1
Data Collection Techniques For Technology Evaluation and Planning

2
Contact Information zjsun@sun-associates.com y978-251-1600 ext. 204 zwww.edtechevaluation.comwww.edtechevaluation.com yThis presentation will be linked to that site (on the Tools page)
.")
3
Where Do We Stand? zWho’s working on an actual project? yCurrent? yAnticipated? zYour expectations for today

4
Objectives zTo review the key elements of effective program evaluation as applied to technology evaluations zUnderstanding the role of data collection in an overall evaluation process zReviewing various data collection strategies

5
Why Evaluate? zTo fulfill program requirements yNCLB and hence Title IID carry evaluation requirements yOne of the 7 seven program requirements for NY Title IID Competitive Grants x“Each grantee will be required to develop “process and accountability measures” to evaluate the extent to which activities funded are effective in (1) integrating technology into curricula and instruction; (2) increasing the ability of teachers to teach; and (3) enabling students to meet challenging State standards. Records relating to these “process and accountability measures” are to be made available on request to the NYS Education Department (or its agents).”
 integrating technology into curricula and instruction; (2) increasing the ability of teachers to teach; and (3) enabling students to meet challenging State standards. Records relating to these process and accountability measures are to be made available on request to the NYS Education Department (or its agents). .")
6
yProject evaluation is also required as an overall part of each proposal… x“Describe the plan for evaluating the effectiveness of the competitive grant project. The plan should include clear benchmarks and timelines to monitor progress toward specific objectives and outcome measures to assess impact on student learning and achievement. It must address the extent to which activities funded are effective in (1) integrating technology into curricula and instruction; (2) increasing the ability of teachers to teach; and (3) enabling students to meet challenging State standards.” y10% of the points…10% of the budget?
 integrating technology into curricula and instruction; (2) increasing the ability of teachers to teach; and (3) enabling students to meet challenging State standards. y10% of the points…10% of the budget .")
7
A Framework for Review

8
Evaluation zHelps clarify project goals, processes, products zMust be tied to indicators of success written for your project’s goals zNot a “test” or checklist of completed activities zQualitatively, are you achieving your goals? zWhat adjustments to can be made to your project to realize greater success?

9
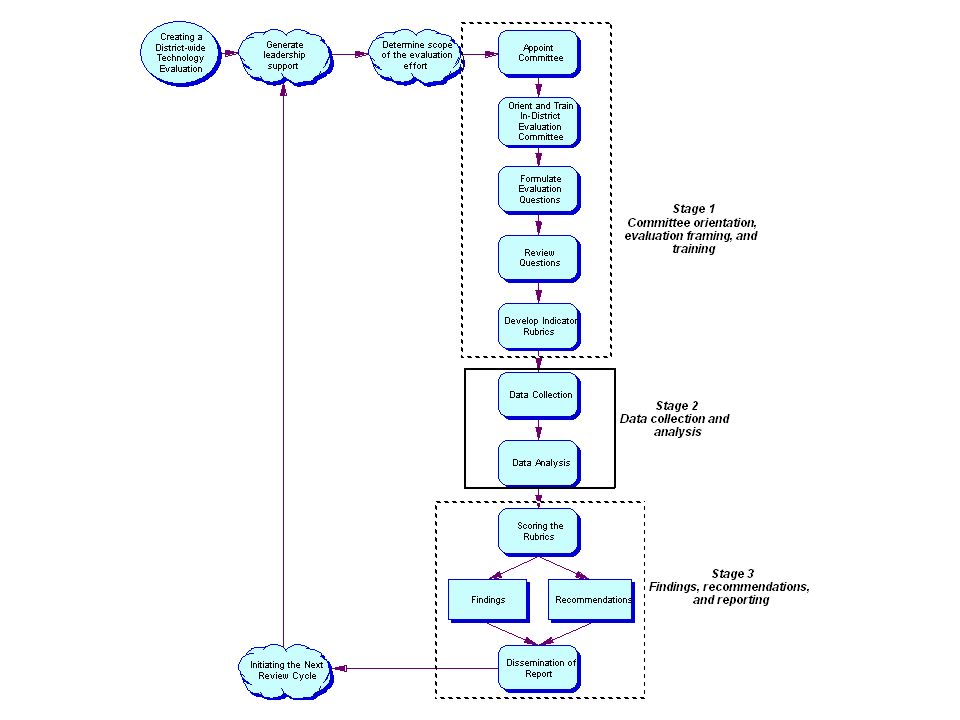
The Basic Process zEvaluation Questions yTied to original project goals zPerformance Rubrics yAllow for authentic, qualitative, and holistic evaluation zData Collection yTied to indicators in the rubrics zScoring and Reporting yRole of this committee (the evaluation committee)
")
10
Who Evaluates? zCommittee of stakeholders (pg 13) zOutside facilitator? zData collection specialists? zTask checklist (pg 11)
.")
11
Data Collection vs. Evaluation zEvaluation is more than data collection zEvaluation is about… yCreating questions yCreating indicators yCollecting data yAnalyzing and using data zData collection occurs within the context of a broader evaluation effort

12
Evaluation Starts with Goals zEvaluation should be rooted in your goals for how you are going to use or integrate technology zA logic map can help highlight the connections between your project’s purpose, goals, and actions yAnd actions form the basis for data collection! ypg 15

13
Example Project Logic Map

14
Goals Lead to Questions zWhat do you want to see happen? yThese are your goals yRephrase goals into questions zAchieving these goals requires a process that can be measured through a formative evaluation

15
We Start with Goals… zTo improve student achievement through their participation in authentic and meaningful science learning experiences. zTo provide advanced science and technology learning opportunities to all students regardless of learning styles or abilities. zTo produce high quality science and technology curriculum in which the integration of technology provides “added value” to teaching and learning activities. zTo increase students’ knowledge of the Connecticut River’s history and geology, and to gain and understanding its past, present and possible future environmental issues.

16
…and move to questions zHas the project developed technology-enhanced science learning experiences that have been instrumental in improving student mastery of the Skills of Inquiry, understanding of the history/geology/ecology of the Connecticut River, and of the 5-8 science curriculum in general? zHas the project offered teacher professional development that has resulted in improved teacher understanding of universal design principles and technology integration strategies?

17
…And Then to Indicators zWhat is it that you want to measure? yWhether the projects have enhanced learning yThe relationship between the units and xThe selected curriculum xThe process by which they were developed yIncreases in teacher technology skills (in relation to particular standards) yWhether the professional development model met with its design expectations xCollaborative and sustainable xInvolves multiple subjects and administrators
 yWhether the professional development model met with its design expectations xCollaborative and sustainable xInvolves multiple subjects and administrators.")
18
zIndicators should reflect your project’s unique goals and aspirations yRooted in proposed work yIndicators must be indicative of your unique environment...what constitutes success for you might not for someone else yIndicators need to be highly descriptive and can include both qualitative and quantitative measures zYou collect data on your indicators

20
Evidence? zClassroom observation, interviews, and work- product review yWhat are teachers doing on a day-to-day basis to address student needs? zFocus groups and surveys yMeasuring teacher satisfaction zTriangulation with data from administrators and staffTriangulation yDo other groups confirm that teachers are being served?

21
Data Collection zReview Existing Data yCurrent technology plan yCurriculum yDistrict/school improvement plans yOthers?

22
Tools and Techniques zSurveys zInterviews zObservations zArtifact Analysis

23
Surveys zOnline vs. Paper yIs there sufficient connectivity? yDoesn’t have to be at the classroom level yOften works best if people complete the instruments all at the same time ySame goes for paper surveys zOnline surveys provide immediate data zSpreadsheets which can be exported to a variety of different programs for analysis

24
Surveys zOnline yVIVEDVIVED yProfilerProfiler yLoTiLoTi yZoomerangZoomerang ySurveyMonkey.comSurveyMonkey.com

25
Make Your Own! zwww.sun-associates.com/neccsurv.htmlwww.sun-associates.com/neccsurv.html zBased on a CGI script on your webserver zOutputs to a text file, readable by Excel zWorks with yes/no, choose from a list, and free text input (no branching) zwww.sun-associates.com/surveyws/surveys.htmlwww.sun-associates.com/surveyws/surveys.html
 zwww.sun-associates.com/surveyws/surveys.htmlwww.sun-associates.com/surveyws/surveys.html.")
26
Survey Tips zKeep them short (under 10 minutes) zAvoid huge long checklists zAllow for text comments zSupport anonymity yBut allow for categorical identifications -- school, job function, grade, etc.
 zAvoid huge long checklists zAllow for text comments zSupport anonymity yBut allow for categorical identifications -- school, job function, grade, etc.")
27
zCoordinate and support survey administration yAvoid the “mailbox stuffer” yWork with building leaders yProvide clear deadlines

28
Three Big Points zSurveys alone mean nothing yTRIANGULATE! z100% response rate is virtually impossible yOn the other hand, nearly 100% is very possible if you follow our tips! zShare the data yNo one wants to fill in forms for no purpose

29
Interviews zServe to back up and triangulate survey data zLess anonymous than surveys yMixed blessing... zAllows for immediate follow-up of interesting findings

30
Interviewing Tips zAs homogenous as feasible yBy grade, job function, etc. zBe attentive to power structures yDon’t mix principals with teachers; tech coordinators with teachers; central office staff with principals; etc.

31
zUse outside interviewers yPeople will explain things to us (because they have to!) yWe avoid the power structure issues yWe’ve done this before zStructure and focus the interviews yUse a well-thought-out and designed protocol yOnly diverge after you’ve covered the basic question
 yWe avoid the power structure issues yWe’ve done this before zStructure and focus the interviews yUse a well-thought-out and designed protocol yOnly diverge after you’ve covered the basic question")
32
Three Big Points zCreate protocols after you’ve seen survey data zHomogeneity and power zUse outsiders to conduct your interviews

33
Observations zThe third leg of your data triangle Observations ySurveys - Interviews - Observations zFamiliar yet different yYou’ve done this before...but not quite zProgressively less “objective” than surveys and interviews

34
Observation Tips zInsure that teachers understand the point and focus of the observations yYou’re evaluating a project, not individuals!! zSample yYou can’t “see” everything ySo think about your sample zYou can learn as much from an empty classroom as an active one yLook at the physical arrangement of the room yStudent materials yHow is this room being used?

35
zOutside observers are necessary unless you simply want to confirm what you already know zAvoid turning observations into a “technology showcase” yShowcases have their place -- mostly for accumulating and reviewing “artifacts” yBut the point of observations is to take a snapshot of the typical school and teacher

36
Three Big Points zObserve the place as well as the people zObservations are not intended to record the ideal...rather, the typical zUse outside observers

37
Artifact Analysis zReviewing “stuff” yLesson plans yTeacher materials yStudent work zCreate an artifact rubric yNot the same as your project evaluation indicator rubric

38
10 Tips for Data Collection zChallenge your assumptions yBut also don’t waste time by asking the obvious zCast a wide net yIt’s all about stakeholders zDig deep yTry to collect the data that can’t easily be observed or counted

39
zUse confirming sources yTriangulate! Surveys alone do nothing. zHave multiple writers yStakeholders and different perspectives zThink before you collect yChoose questions carefully and with regard to what you really expect to find

40
zSet (reasonable) expectations for participation yTime and effort zForget about mailbox surveys yUsually waste more time than their value zReport back yDon’t be a data collection black hole!
 expectations for participation yTime and effort zForget about mailbox surveys yUsually waste more time than their value zReport back yDon’t be a data collection black hole!")
41
zIt’s a process, not an event! yIt does little good to collect data once and then never again yData collection is part of a long-term process of review and reflection yEven if the immediate goal is only to get “numbers” for the state forms

42
Dissemination zCompile the report zDetermine how to share the report ySchool committee presentation yPress releases yCommunity meetings

43
Conclusion zBuild evaluation into your technology planning effort zRemember, not all evaluation is quantitative zYou cannot evaluate what you are not looking for, so it’s important to — zDevelop expectations of what constitutes good technology integration

44
zData collection is not evaluation yRather, it’s an important component zData must be collected and analyzed within the context of a goal-focused project indicators

45
More Information zjsun@sun-associates.com y978-251-1600 ext. 204 zwww.sun-associates.com/evaluationwww.sun-associates.com/evaluation zwww.edtechevaluation.comwww.edtechevaluation.com

Similar presentations


>")


