Download presentation
Presentation is loading. Please wait.

1
Algebra Readiness Using Data to Inform Decisions

2
Levels of Data Item AnalysisStandards AnalysisGrowth Analysis

3
Quick / Accessible Data Teacher ●Make instructional decisions ●Personalize learning more easily Admin ●Identify areas for professional development ●Growth measure for evaluation and support of staff Student ●Self-identify areas for growth ●Receive resources based on performance

4
Assessments Available 2015-2016 Algebra Readiness v.2 Geometry Readiness Algebra 2 Readiness Northview Math Department -Connection to Middle School via Student Data -Need Student Understanding Entering Courses

5
Why: Current State Professional Learning -Content -Focus -Communication We encourage teachers to use data to drive their instruction. Professional learning shouldn’t be any different. How do we/you currently decide professional learning needs?

6
How: Collect Data Classroom Level: -Administer Pre Assessment -Teach the Content -Administer Post Assessment District Level: -Support Pre and Post Vision -Utilize Data Collection Tools

7
What: Teacher Story Previous Story: Student Focus -Strengths and Weaknesses -Past Mathematics Progression -Demographics Administration Focus -Identify Effective Practice

8
Through PD of Course!

9
Traditional Delivery of PD -Discussions w/ colleagues -Professional Learning Communities -PD days -Attend conferences

10
Traditional PD Challenges -Isolation

11
-Unique needs Traditional PD Challenges

12
-Isolation -Unique needs -Time Traditional PD Challenges

13
-Isolation -Unique needs -Time -Need vs. Want Traditional PD Challenges

15
Webinars

16
Webinars are... ●Short ●Focused ●Open ●Recorded

18
Online PD Course

19
Online PD Courses are... ●3+ Hours ●SCECH Eligible ●Customizable

23
Steps to Follow ●Review data, identify trends ●Interview and observe teachers o Identify what is going well and what isn’t ●Create PD plan o webinar, online PD, etc

24
Put Data in the Driver’s seat

25
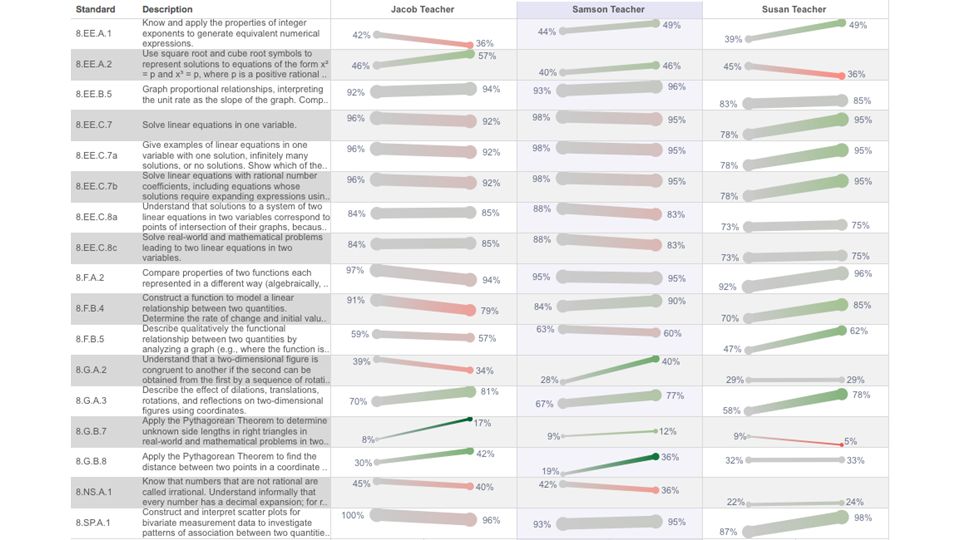
Scenario #1 ●8.F.B.5 - One Teacher o Survey staff that don’t show growth o Interview teacher teacher that shows growth Data tells us that struggling teachers are following textbook and not allowing students the opportunity to create models (the graphs) after they did Good teacher blocks out the graphs and has the kids create the data because she understands that this is an algebra readiness standard o Good teacher can create create a video or run a webinar to teach others how to she teaches that standard
 after they did Good teacher blocks out the graphs and has the kids create the data because she understands that this is an algebra readiness standard o Good teacher can create create a video or run a webinar to teach others how to she teaches that standard")
26
Scenario #2 ●8.NS.A.1 - Entire Staff o Survey all teachers (for times’ sake) o Results show that all teachers are using a common lesson to teach irrational numbers, which is very definition-based o Share results to curriculum admin and/or Kent ISD math consultant o results indicate that students need to dive deeper so they have a conceptual understanding of irrational numbers o Curriculum admin or consultant can create a course that meets the teachers’ need Just so happens we have a course on that ● Rusty’s inquiry in math course ● Teachers can go through this together, discuss in PLC’s
 o Results show that all teachers are using a common lesson to teach irrational numbers, which is very definition-based o Share results to curriculum admin and/or Kent ISD math consultant o results indicate that students need to dive deeper so they have a conceptual understanding of irrational numbers o Curriculum admin or consultant can create a course that meets the teachers’ need Just so happens we have a course on that ● Rusty’s inquiry in math course ● Teachers can go through this together, discuss in PLC’s")
27
What’s Possible ●This is data from just 3 teachers in one building, it doesn’t give us much that we can act on ●We need more data points ●Can achieve this 1 of 2 ways ○Gather trend data from a small group over multiple years ○Gather data from a larger group ●We can figure this out faster if we all work together and use the same measuring tools

28
Andrew’s Part ●What is possible ●Seek out effective practices ●Organize o Observe o Interview o Data ●Get to the masses

Similar presentations