Download presentation
Presentation is loading. Please wait.

1
Lecture 5: Who are the poor? Today’s readings: Schiller Ch. 3: Counting the Poor, pp. 60-66 Current Population Report, P60-231, pp. 13-19, 45-58 DeParle, Ch. 3: The Crossroads: Chicago, 1966-1991

2
Today’s Topics Sen’s definition of poverty and its implications What we learn from studying poverty spells--the dynamics of poverty Who are America’s poor? Calculating poverty rates

3
Sen’s Capability Deprivation 1.What definition of poverty does Sen propose? –Why is measuring “lowness of income” inadequate as a measure of poverty? 2.How do you think Sen might respond to the claims of some that by world standards, no Americans are poor?

4
Sen’s Capability Deprivation 3.Is it feasible to measure poverty using Sen’s definition? a)Human Poverty Index, 1)For definition see: http://www.adb.org/Statistics/Poverty/H.asp http://www.adb.org/Statistics/Poverty/H.asp 2)For for values, rankings, and trends, see: http://hdr.undp.org/reports/global/2005/pdf/HDR05_HD I.pdf (p. 228) http://hdr.undp.org/reports/global/2005/pdf/HDR05_HD I.pdf b)Human Development Index, http://en.wikipedia.org/wiki/Human_Development_Index#Top_thirty_coun tries http://en.wikipedia.org/wiki/Human_Development_Index#Top_thirty_coun tries
Human Poverty Index, 1)For definition see: 2)For for values, rankings, and trends, see: I.pdf (p. 228) I.pdf b)Human Development Index, tries tries.")
5
Sen’s Capability Deprivation –How would Sen respond to the claims of some that by world standards, no Americans are poor?

6
Sen’s Capability Deprivation 4.What are the implications of Sen’s analysis for the formulation of policies to aid the poor? –Hint: consider the following quotation: “What the capability perspective does.... is to enhance the understanding of the nature and causes of poverty and deprivation by shifting primary attention away from the means [income].... to ends and.... and to the freedom’s to be able to satisfy these ends.” (p. 90)
.")
7
Poverty Spells Mary Jo Bane and David Ellwood,“Slipping into and Out of Poverty: The Dynamics of Spells,” The Journal of Human Resources, Vol. 21, No. 1 (Winter, 1986), 1-23. (Source for the following 6 slides.) 1.What are poverty spells? 2.Why study poverty spells? 3.What is the distribution of poverty spells by length? 4.How do poverty spells begin? 5.How do poverty spells end? 6.What does the analysis of poverty spells tell us about welfare dependency?
, (Source for the following 6 slides.) 1.What are poverty spells. 2.Why study poverty spells. 3.What is the distribution of poverty spells by length. 4.How do poverty spells begin. 5.How do poverty spells end. 6.What does the analysis of poverty spells tell us about welfare dependency .")
8
Bane and Ellwood “Slipping Into and Out of Poverty” What are poverty spells? –Continuous periods during which income falls below the poverty line. Why study poverty spells? –Because we need to distinguish between the larger population of people who are ever poor, and those who are poor at a point in time if we are the understand the effects of culture, dependency, and the allocation of assistance.

10
Poverty Spells: Bane and Ellwood Distribution of Completed Spells of Poverty

11
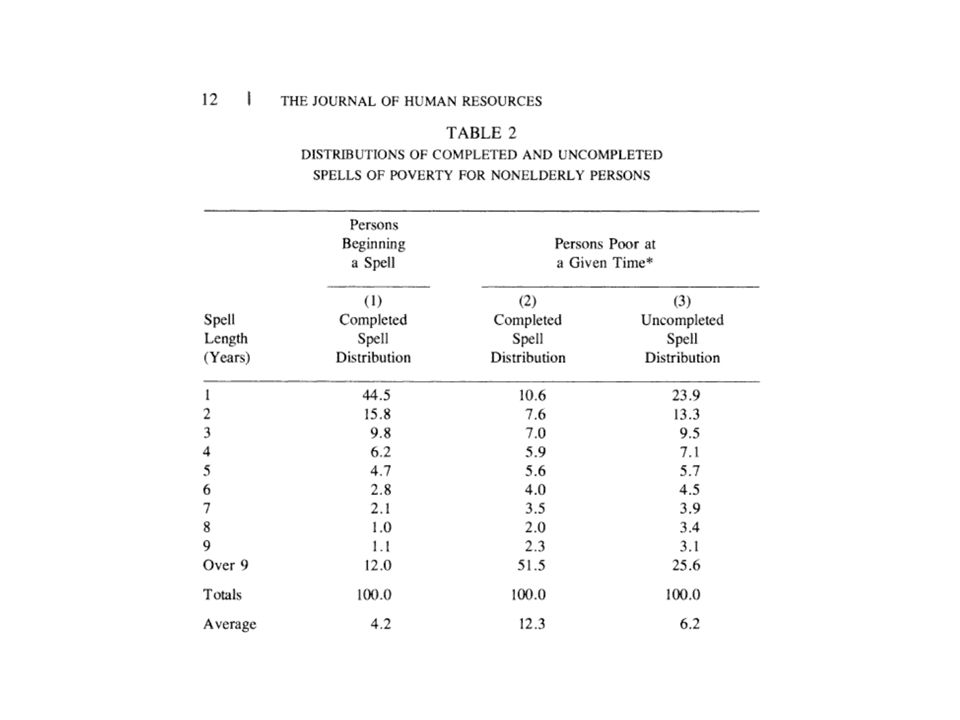
Poverty Spells: Bane and Ellwood Distribution of Completed and Uncompleted Spells of Poverty

13
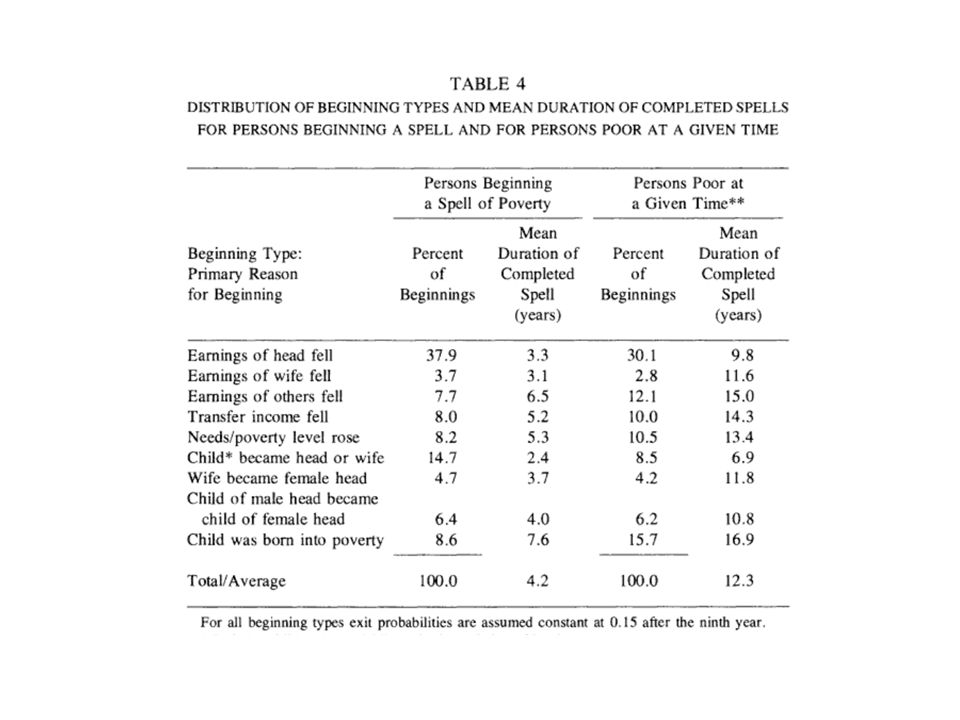
Bane and Ellwood Conclusions of “Slipping Into and Out of Poverty” 1.Most of those who ever become poor will have a short stay in poverty. 2.The majority of those who are poor at a given time will have very long spells of poverty. 3.Most people use aid programs briefly. 4.The bulk of aid goes to a small group that has very long stays in poverty. 5.Changes in family structure and life cycle events explain nearly one- half of spell beginnings. 6.A fall in the head’s earnings explain a small minority of beginnings. 7.Increase earnings of all household members is the primary route out of poverty. 8.The poverty population is extremely heterogeneous.

14
Poverty Spells Consequences of Bane and Ellwood’s Work –Survey of Income and Program Participation (SIPP)--a longitudinal survey that allow the analyst to observe how the status of the same group of people changes over time; ie., to study the dynamics of poverty. http://www.census.gov/hhes/www/poverty/newgui dance.html#sipphighlight http://www.census.gov/hhes/www/poverty/newgui dance.html#sipphighlight –Methodology applied to spells of welfare receipt

15
Who are America’s Poor? Snapshots from the CPR Use CPR P60-231 to answer the following questions for 2005: a.Which age group has the highest poverty rates? b.Which family type has the highest poverty rates? c.Is the risk of poverty greater for recent immigrants or native-born Americans? d.Rank the following racial categories from highest poverty rate to lowest poverty rate: American Indian/Alaskan Native, Asian, Black, Hispanic, White.

16
Who are America’s Poor? Where are the poor most likely to live? e.Northeast, Midwest, South, or West? f.Central cities, suburbs, or outside metropolitan areas?

17
Who are America’s Poor? g.How much greater is the risk of poverty for children living their mothers only than for children who live with married couples? h.On average, how much income was needed to pull poor families out of poverty in 2005?

18
Calculating Poverty Rates (People in Thousands,Table B-1, P60-231) 123456 Race Total Number Percent of all Persons Number in Poverty Poverty Rate (%) Percent of all Poor Persons a White Alone, Not Hispanic 195,553 195,553/293,135 =.667 x 100 = 66.7% 16,227 16,227/195,553 =.086 x 100 = 8.3% 16,227/36,950 =.439 x 100 = 43.9% b Black Alone36,802 36,802/293,135 =.126 x 100 = 12.6% 9,168 9,168/36,802 =.247 x 100 = 24.9% 9,168/36,950 =.243 x 100 = 24.8% c Hispanic (Any Race) 43,020 43,020/293,153 =.147 x 100 = 14.7% 9,368 9,368/ 43,020 =.219 x 100= 21.8% 9,368/36,950 =.246 x 100 = 25.4% d All Persons293,135na36,95012.6%94.1%
 Race Total Number Percent of all Persons Number in Poverty Poverty Rate (%) Percent of all Poor Persons a White Alone, Not Hispanic 195, ,553/293,135 =.667 x 100 = 66.7% 16,227 16,227/195,553 =.086 x 100 = 8.3% 16,227/36,950 =.439 x 100 = 43.9% b Black Alone36,802 36,802/293,135 =.126 x 100 = 12.6% 9,168 9,168/36,802 =.247 x 100 = 24.9% 9,168/36,950 =.243 x 100 = 24.8% c Hispanic (Any Race) 43,020 43,020/293,153 =.147 x 100 = 14.7% 9,368 9,368/ 43,020 =.219 x 100= 21.8% 9,368/36,950 =.246 x 100 = 25.4% d All Persons293,135na36, %94.1%")
19
Over and Under-representation Among the Poor Which racial groups are over-represented among the poor? Which are under- represented? –Compare group’s poverty rate to overall poverty rate. If PR G > PR all, Group is over-represented. If PR G < PR all, Group is under-represented. –Compare columns (3) and (6) by row. –Conclusions: Blacks and Hispanics are over-represented. Whites are under-represented.
 and (6) by row. –Conclusions: Blacks and Hispanics are over-represented. Whites are under-represented..")
Similar presentations