Download presentation
Presentation is loading. Please wait.

1
A Comparative Evaluation of Cortical Thickness Measurement Techniques P.A. Bromiley, M.L.J. Scott, and N.A. Thacker Imaging Science and Biomedical Engineering University of Manchester

2
Introduction The cerebral cortex: –largest part of the brain –highly convoluted 2D sheet of neuronal tissue –laminar structure –min. thickness ~2mm (calcarine sulcus) –max. thickness ~4mm (precentral gyrus) –av. thickness ~3mm
 –max. thickness ~4mm (precentral gyrus) –av. thickness ~3mm.")
3
Introduction Volume measurements are well established –e.g. dementia, ageing Thickness provides additional information –correlations with Alzheimer’s, Williams syndrome, schizophrenia, fetal alcohol syndrome…

4
Introduction Free from region definition v t

5
Introduction More robust to misregistration –volume error misregistration v1v1 v2v2

6
Introduction More robust to misregistration –median thickness error t / n

7
Introduction Two approaches: –model based (e.g. ASP, McDonald et al. 2000) fit deformable model to inner surface expand to reach outer surface measure distance between corresponding vertices –data-driven use edge detection to find inner surface find 3D normal search along normal for another edge
 fit deformable model to inner surface expand to reach outer surface measure distance between corresponding vertices –data-driven use edge detection to find inner surface find 3D normal search along normal for another edge.")
8
The problem… Partial volume effect may obscure outer surface (from McDonald et al. 2000)
")
9
Model Bias Impose constraints the force spherical topology and force the models into thin sluci: –distance between vertices on inner and outer surfaces –surface self proximity –may introduce bias –takes ages to run

10
The TINA Cortical Thickness Algorithm Scott et al., MIUA 2005 –find inner surface –search along 3D normal –process edges, dips found

11
AIM Can data driven techniques be as accurate as model-based ones? Can we find evidence of model bias?

12
Evaluation 119 normal subjects, 52 male, age 19-86 (μ=70.3) –T1-weighted IR scans: suppresses inhomogeneity
 –T1-weighted IR scans: suppresses inhomogeneity")
13
Evaluation Meta-studies: –youngest 13 compared to Kabani et al. manual and automatic (model based) –precentral gyrus thickness vs. age compared to 8 previous publications for all 119 subjects …if we can see aging, we can see disease
 –precentral gyrus thickness vs. age compared to 8 previous publications for all 119 subjects …if we can see aging, we can see disease.")
14
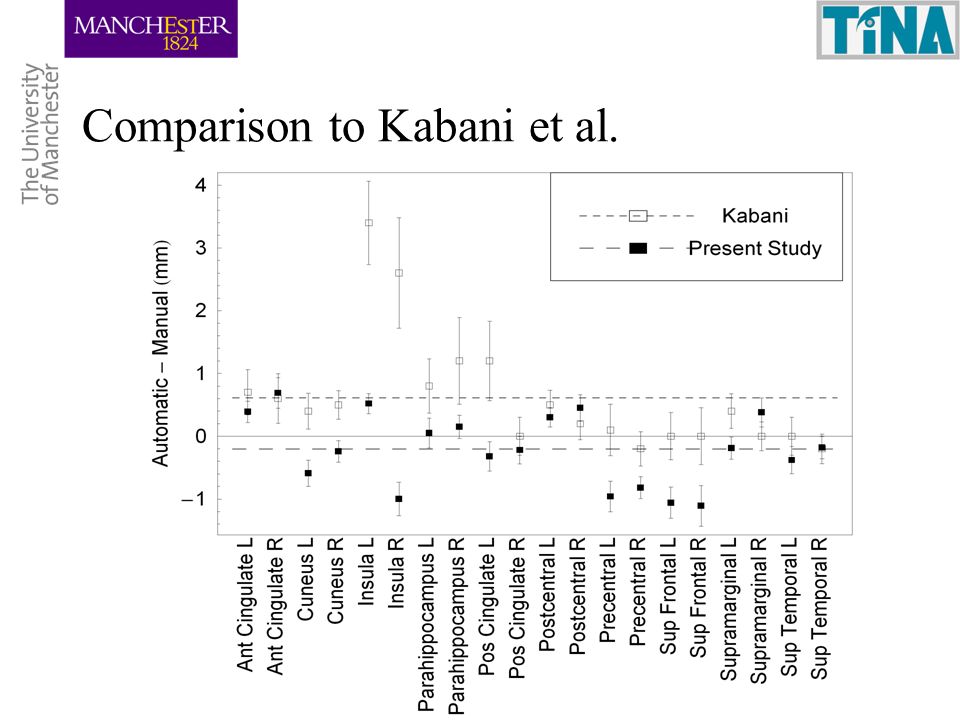
Comparison to Kabani et al.

16
From error propagation, expected error on an individual ~0.1mm Mean differences –present study: –0.21 +/- 0.22 mm –Kabani et al.: 0.61 +/- 0.43 mm –=> mostly group variability No evidence of systematic error Data-driven technique has ~2x lower random errors

17
Precentral Gyrus Study Meta-study incorporating 635 subjects: ReferenceNo. Age range (years)Algorithm type Kabani et al. (2001)4018-40Model based Von Economo (1929)-30-40Manual measurement Sowell et al. (2004)455-11Intensity based Tosun et al. (2004)10559-84Model based Fischl et al. (2005)3020-37Model based Thompson et al. (2005)4018-48Intensity based MacDonald et al. (2000)15018-40Model based Salat et al. (2004)10618-93Model based Present study11919-86Intensity based
Algorithm type Kabani et al. (2001) Model based Von Economo (1929)-30-40Manual measurement Sowell et al. (2004)455-11Intensity based Tosun et al. (2004) Model based Fischl et al. (2005) Model based Thompson et al. (2005) Intensity based MacDonald et al. (2000) Model based Salat et al. (2004) Model based Present study Intensity based.")
18
Precentral Gyrus Study Colourmap representations –error estimation is not possible –bias from inflated/non-inflated representations (from Fischl et. al., 2000)
.")
19
Precentral Gryus Study

20
Conclusions Results from all other studies are consistent –random errors dominated by natural variation Data-driven cortical thickness measurement –free from model bias –order of magnitude faster –at least as accurate …compared to model-based techniques Bias may have been seen in the Salat et al. results? –don’t use prior measurement to make measurement

Similar presentations


 Hugues Hoppe (Microsoft Research)>")
 parameter fitting via.>")
 Department of Radiology and BRIC UNC-Chapel Hill IDEA.>")

 scans, it is possible to calculate an Apparent Diffusion Coefficient (ADC) for a Region of Interest.>")
, glial cells, capillaries, and short nerve cell extensions (axons and.>")


