Download presentation
Presentation is loading. Please wait.

1
Cardiovascular Response to Strength Training

2
Chronic Adaptation at Rest Decrease rest Heart rate (HR) and Blood pressure (BP) Change in Blood lipid Change in cardiac morphology, Stroke volume (SV), Cardiac output (CO)
 and Blood pressure (BP) Change in Blood lipid Change in cardiac morphology, Stroke volume (SV), Cardiac output (CO)")
3
Adaptation at rest Heart rate Blood pressure systolic systolic diastolic diastolic Double product Stroke volume (absolute) Relative BSA Relative LBM Cardiac systolic function Cardiac diastolic function Lipid profile total cholesterol total cholesterol HDL-C HDL-CLDL-C ↓or no change ↑or no change No change No change ↑or no change No change No change ↓or no change ↑or no change ↓or no change
 Relative BSA Relative LBM Cardiac systolic function Cardiac diastolic function Lipid profile total cholesterol total cholesterol HDL-C HDL-CLDL-C ↓or no change ↑or no change No change No change ↑or no change No change No change ↓or no change ↑or no change ↓or no change")
4
Heart Rate (HR) Short-term longitudinal studies report decreases of from 5 to 12% Decrease resting HR is normally attributed to a combination of increased parasympathetic and diminished tone
 Short-term longitudinal studies report decreases of from 5 to 12% Decrease resting HR is normally attributed to a combination of increased parasympathetic and diminished tone")
5
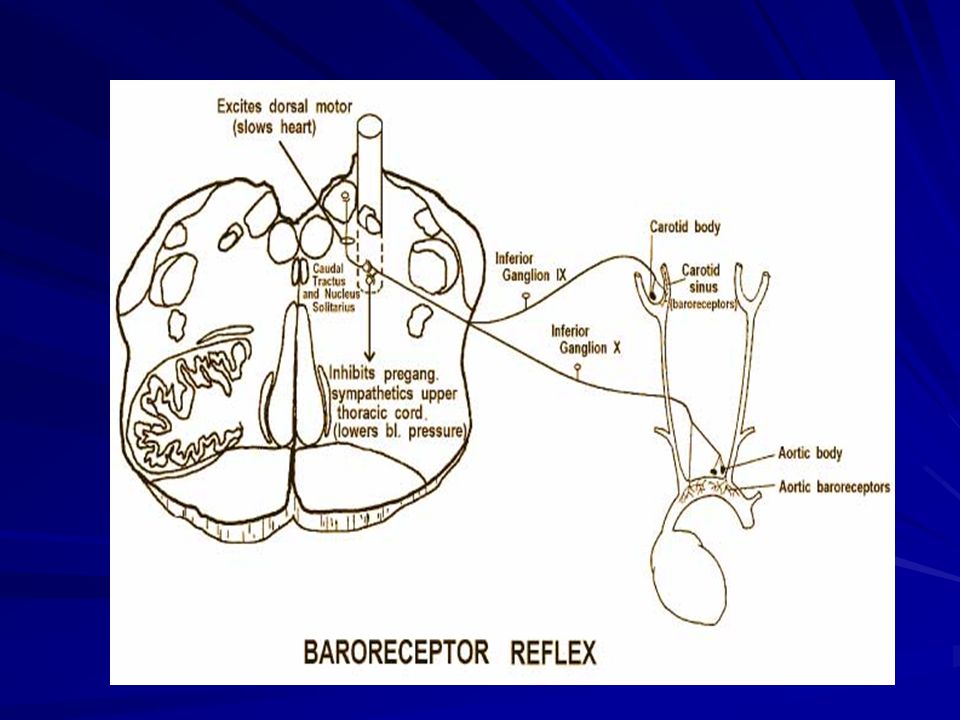
Nervous System Regulation of Heart Rate

6
The spontaneous activity of autonomic nerves is regulated by different types of sensory receptors in the body that monitor physiological function NTS: nucleus tractus solitarius (NTS) of the medulla Receptor afferents: Sensory receptors that are involved in regulating blood pressure are called baroreceptors
 of the medulla Receptor afferents: Sensory receptors that are involved in regulating blood pressure are called baroreceptors")
7
Pulse pressure –Difference between systolic and diastolic Mean arterial pressure (MAP) –Average pressure in the arteries MAP = Diastolic + 1 / 3 (pulse pressure) Pulse Pressure = Systolic - Diastolic Blood Pressure (BP)
 –Average pressure in the arteries MAP = Diastolic + 1 / 3 (pulse pressure) Pulse Pressure = Systolic - Diastolic Blood Pressure (BP)")
8
Highly trained athletes to have average or lower than average systolic and diastolic blood pressure (SBP/DBP) Mean changes in resting systolic and diastolic blood pressures after two months of combined strength and endurance exercise
 Mean changes in resting systolic and diastolic blood pressures after two months of combined strength and endurance exercise")
10
Misconceptions Strength training causes hypertension? Some athletes observed hypertension may be: –Essential hypertension –Chronic overtraining –Use of androgens –Large gains of muscle mass

11
Possible Explanations Increase body fat Increase body salt Alternations of the sympathoadrenal drive Adrenergic and Cholinergic Receptors in Blood Vessels

12
Double Product DP=HR × SBP An estimate of myocardial work and is proportional to myocardial oxygen consumption Longitudinal strength training decrease the rest double product Indicating a decrease in myocardial oxygen consumption at rest as an adaptation to strength training

13
Stroke Volume Increase absolute stroke volume is due to a greater diastolic left ventricular diameter and a normal ejection fraction the stroke volume is 75 ml for an untrained man at rest, and 105 ml for a trained athlete at rest

14
Lipid Profile The effects of strength training on lipid profile is controversial in male, female subjects, also in longitudinal and cross-section designs These studies be criticized: –Inadequate control of age –Diet –Training regimes –Androgen use –Single blood sample –Change in body composition –Effect from last training session

15
Programmes using 8-12 rep. per set of an exercise and short rest periods may more positively affect lipid profile than heavy resistance for 1-6 rep. per set and long rest period. Lipid Profile

16
Lipoprotein measurement Low amount, moderate intensity Low amount, high intensity High amount, high intensity p* LDL cholesterol (mg/dL) +5.1+2.1-3.60.01 HDL cholesterol (mg/dL) +1.1+.8+3.80.005 Triglycerides (mg/dL) -50.4-13.3-200.002 LDL particles (nmol/L) -59-6-960.002 Small LDL particles (mg/dL of cholesterol) +4.7+1.3-9.8<0.001 Lipid Profile and Intensity of Exercise
 HDL cholesterol (mg/dL) Triglycerides (mg/dL) LDL particles (nmol/L) Small LDL particles (mg/dL of cholesterol) <0.001 Lipid Profile and Intensity of Exercise")
17
Size of LDL particles (nm) +0.1+0.1+0.30.05 Large VLDL particles (mg/dL of triglycerides) -42-13.5-14.50.03 Size of VLDL particles (nm) -6.5-4.1-1.10.04 Large HDL particles (mg/dL of cholesterol) +0.9+0.9+4.90.02 Size of HDL particles (nm) 00+0.20.02 p for intention-to-treat analysis, comparing changes in high-amount, high-intensity group with changes in control patients.To download table as slides, click on slide logo below Lipoprotein measurement Low amount, moderate intensity Low amount, high intensity High amount, high intensity p*
 Large VLDL particles (mg/dL of triglycerides) Size of VLDL particles (nm) Large HDL particles (mg/dL of cholesterol) Size of HDL particles (nm) p for intention-to-treat analysis, comparing changes in high-amount, high-intensity group with changes in control patients.To download table as slides, click on slide logo below Lipoprotein measurement Low amount, moderate intensity Low amount, high intensity High amount, high intensity p*")
18
Cardiac morphology adaptations at rest Relative to: AbsoluteBSALBM Wall Thickness Left ventricle Left ventricle Septum Septum Right ventricle Right ventricle Chamber volume Left ventricle Left ventricle Right ventricle Right ventricle Left ventricular mass ↑ ↑ ↑ No change No change ↑ ↑or no change No change No change ↑↑ ↑or no change ↑↑or no change No change No change ↑↑or no change No change No change ↑or no change

19
Cardiac Wall Thickness Diastolic posterior left ventricular (PWTd) and intraventricular septum (IVSd) most common use to determine wall thickness using echocardiographic techniques
 and intraventricular septum (IVSd) most common use to determine wall thickness using echocardiographic techniques")
20
Highly trained male’s absolute PWTd and IVSd is increased due to strength training This increase is reduced if examine relative to body surface area or lean body mass Increased wall thickness is caused by intermittent elevated BP during training and related to the caliber of athlete and to the strength training intensity and volume

21
Chamber Dimensions As an indication of volume overload on the heart Commonly found in endurance athletes Bodybuilder greater left ventricular internal dimensions, in absolute or relative to body surface or lean body mass but not in Weightlifter Bodybuilder greater left ventricular internal dimensions, in absolute or relative to body surface or lean body mass but not in Weightlifter Strength-training do not increase cardiac chamber size which may increase after bodybuilding-type programmes

22
Left ventricular mass National/international calibre > less calibre Bodybuilder=weightlifter > control Bodybuilder ↑chamber size and wall thickness Weightlifter ↑chamber size ↑is related to the intensity and calibre of athletes

23
Feature Athletic Heart SyndromeCardiomyopathy. Left ventricular hypertrophy 15 mm Left ventricular end-diastolic 70 mm diameter Diastolic function Normal (E:A ratio > 1) Abnormal (E:A ratio < 1) Septal hypertrophy Symmetric Asymmetric (in hypertrophic cardiomyopathy) Family history None May be present BP response to exercise Normal Normal or reduced systolic BP response Deconditioning Left ventricular No left ventricular hypertrophy regression hypertrophy regression. Features Distinguishing Athletic Heart Syndrome From Cardiomyopathy
 Abnormal (E:A ratio < 1) Septal hypertrophy Symmetric Asymmetric (in hypertrophic cardiomyopathy) Family history None May be present BP response to exercise Normal Normal or reduced systolic BP response Deconditioning Left ventricular No left ventricular hypertrophy regression hypertrophy regression. Features Distinguishing Athletic Heart Syndrome From Cardiomyopathy.")
24
Systolic Function Measurement –% fractional shortening (%FS) –Ejection fraction (Ef) (normal =55-77%) –Velocity of circumferential shortening (VCS) Greater %FS in athletes than control (32 vs. 37%) Most data show strength training have no effect on systolic function
 Most data show strength training have no effect on systolic function.")
25
Diastolic Function Abnormalities in diastolic function are associated with cardiac hypertrophy due to hypertension Power-lifters –Greater absolute and relative to body surface area left ventricular mass

26
Factors Increasing Diastolic Pressure Impaired Ventricular Relaxation Increased Ventricular Stiffness Hypertrophy Myocardial ischemia Hypertension Collagen deposition and fibrosis Regional asynchrony Increased preload, afterload Abnormal calcium flux Tachycardia Hypertrophy Hypertension Collagen deposition and fibrosis Cellular disarray Myocardial infiltration Pericardial constriction or restriction

27
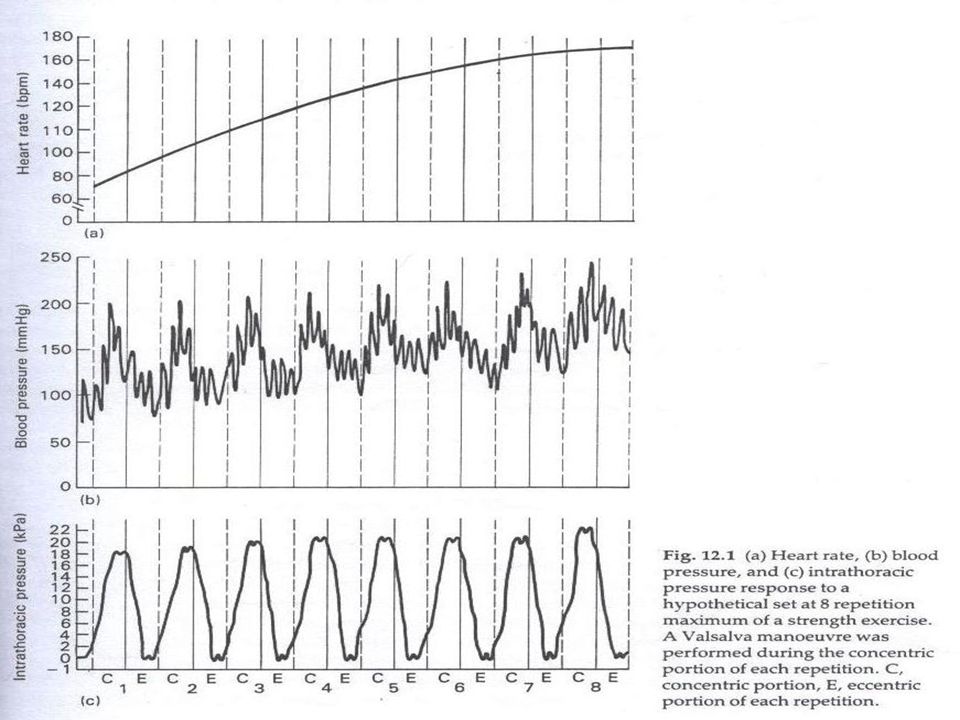
Acute response HR, SBP, and DBP increase during the performance of dynamic heavy strength exercise Highest HR and BP normally occur during the last repetitions of a set to volitional fatigue HR, BP and CO response increase with increased active muscle mass The response is not linear

28
Acute response of strength exercise relative to rest Position of repetition ConcentricEccentric Heart rate Blood pressure Systolic Systolic Diastolic Diastolic Intra-thoracic pressure Cardiac output Stroke volume ↑↑↑↑ No change? ↑↑↑↑↑?↑?

30
Strength training with Valsalva maneuvers which elevate intra-thoracic pressure would lead to a greater BP Concentric portion of exercise may mechanically induce an increase in peripheral resistance The increased intra-thoracic pressure may have a protective function for the cerebral blood vessels

31
Factors result in an increase in preload (by causing fluid retention and venous constriction) and an increase in heart rate and contractility, thereby raising cardiac output
 and an increase in heart rate and contractility, thereby raising cardiac output")
32
Chronic adaptation during strength exercise Lower maximal systolic and diastolic intra- arterial BP and HR max during strength training in body builders (absolute and relative workload) Cross-section and longitudinal data have shown that strength training can result in a lower pressor response and lower myocardial oxygen consumption
 Cross-section and longitudinal data have shown that strength training can result in a lower pressor response and lower myocardial oxygen consumption")
33
Decrease BP during activity resulting in a decreased after load on the left ventricle Forceful Vasalva manoeuver may elevate intrathoracic and intra abdominal pressure in power lifter that lower CO

34
VO 2 max increase in some but not all strength programmes Factors affecting VO 2 max after strength training –Total training volume –Rest periods between sets –Large vs small muscle mass exercise

35
Adaptation during exercise due to strength training relative to normals Heart rate Blood pressure Systolic Systolic Diastolic Diastolic Double product Cardiac output Stroke Volume VO 2max ↓ ↓ or no change ↓↑↑↑

36
Conculsion Strength training does not result in a pressor response that has an impact upon the cardiovascular system Long-term performance of strength training can result in positive adaptations of the cardiovascular system at rest and during work The extent of these adaptations may in large part be dependent upon the volume and intensity if strength training performed

37
Discussion How do you design a resistance training for a lower fitness, middle-aged male who could be able to reduce his blood pressure from 138/95 to 120/80. What do you think why an intense strength training could change the preload and afterload of heart (e.g. 85% 1RM). What would be a possible explanation regarding the effect of weight training on autonomic nerve system’s responses and adaptations.
. What would be a possible explanation regarding the effect of weight training on autonomic nerve system’s responses and adaptations..")
Similar presentations


 exercise Maximal exercise Chronic exercise Chronic exercise –Months.>")


 September 28, 2005 October 5, 2005 EXS 558 Dr. Moran.>")


