Download presentation
Presentation is loading. Please wait.

1
Hypothesis Testing

2
Central Limit Theorem Hypotheses and statistics are dependent upon this theorem.

3
Central Limit Theorem To understand the Central Limit Theorem we must understand the difference between three types of distributions…..

4
A distribution is a type of graph showing the frequency of outcomes:

5
A distribution is a type of graph showing the frequency of outcomes:

6
Of particular interest is the “normal distribution”

7
Different populations will create differing frequency distributions, even for the same variable…

8
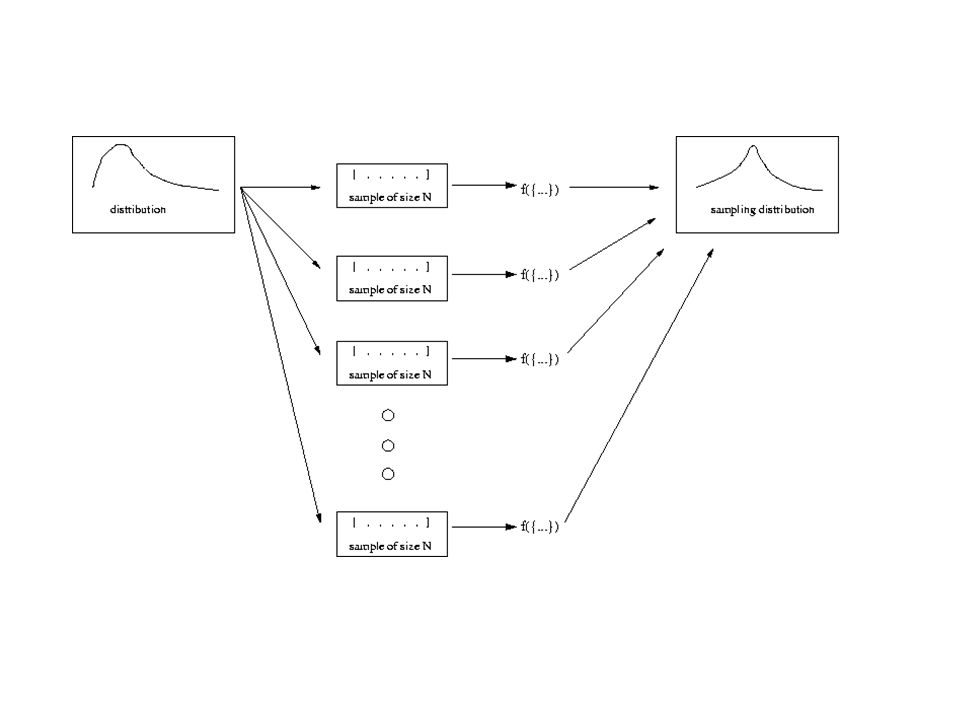
There are three fundamental types of distributions: 1. Population distributions

9
There are three types of distributions: 1. Population distributions

10
There are three types of distributions: 1. Population distributions

11
There are three types of distributions: 1. Population distributions

12
There are three types of distributions: 1. Population distributions 2. Sample distributions

13
There are three types of distributions: 1. Population distributions 2. Sample distributions

14
There are three types of distributions: 1. Population distributions 2. Sample distributions 3. Sampl ing distributions

15
These three distributions are related: 1. Population distributions The frequency distributions of a population.

16
These three distributions are related: 2. Sample distributions The frequency distributions of samples. The sample distribution should look like the population distribution….. Why?

17
These three distributions are related: 2. Sample distributions The frequency distributions of samples.

18
These three distributions are related: 3. Sampl ing distributions The frequency distributions of statistics.

19
These three distributions are related: 2. Sample distributions The frequency distributions of samples. The sampling distribution should NOT look like the population distribution….. Why?

22
Suppose we had population distributions that looked like these:

23
Say the mean was equal to 40, if we took a random sample from this population of a certain size n… over and over again and calculated the mean each time……

24
We could make a distribution of nothing but those means. This would be a sampling distribution of means.

25
Some questions about this sampling distribution:

26
1. What would be the mean of all those means?

27
2. If the population mean was 40, how many of the sample means would be larger than 40, and how many would be less than 40?

28
Regardless of the shape of the distribution below, the sampling distribution would be symmetrical around the population mean of 40.

29
3. What will be the variance of the sampling distribution?

30
The means of all the samples will be closer together (have less variance) if the variance of the population is smaller.
 if the variance of the population is smaller.")
31
The means of all the samples will be closer together (have less variance) if the size of each sample (n) gets larger.
 if the size of each sample (n) gets larger.")
34
So the sampling distribution will have a mean very close to the population mean, and a variance inversely proportional to the size of the sample (n), and proportional to the variance of the population. http://www.youtube.com/watch?v=zr-97MVZYb0

35
Central Limit Theorem

36
If samples are large, then the sampling distribution created by those samples will have a mean equal to the population mean and a standard deviation equal to the standard error.

37
Sampling Error = Standard Error

38
The sampling distribution will be a normal curve with: and

39
This makes inferential statistics possible because all the characteristics of a normal curve are known.

41
http://www.statisticalengineering.com/central_limit_theorem.htm A great example of the theorem in action….

42
Hypothesis Testing: A statistic tests a hypothesis: H 0

43
Hypothesis Testing: A statistic tests a hypothesis: H 0 The alternative or default hypothesis is: H A

44
Hypothesis Testing: A statistic tests a hypothesis: H 0 The alternative or default hypothesis is: H A A probability is established to test the “null” hypothesis.

45
Hypothesis Testing: 95% confidence: would mean that there would need to be 5% or less probability of getting the null hypothesis; the null hypothesis would then be dropped in favor of the “alternative” hypothesis.

46
Hypothesis Testing: 95% confidence: would mean that there would need to be 5% or less probability of getting the null hypothesis; the null hypothesis would then be dropped in favor of the “alternative” hypothesis. 1 - confidence level (.95) = alpha
 = alpha.")
47
Errors:

48
Type I Error: saying something is happening when nothing is: p = alpha

49
Errors: Type I Error: saying something is happening when nothing is: p = alpha Type II Error: saying nothing is happening when something is: p = beta

51
http://www.intuitor.com/statistics/T1T2Errors.html An example from court cases: http://www.youtube.com/watch?v=taEmnrTxuzo

52
Care must be taken when using hypothesis testing… PROBLEMS I hypothesize that a barking dog is hungry.

53
The dog barks, is the dog therefore hungry?

54
To answer that questions, I would have to have some prior information. For example, how often does the dog bark when it is not hungry.

55
Suppose we flipped a coin a hundred times…. It came up heads 60 times. Is it a fair coin?

56
No…. Because a Z-test finds that the probability of doing that is equal to 0.0228. We would reject the Null Hypothesis!

57
Suppose we flipped the same coin a hundred times again… It came up tails 60 times. Is it a fair coin?

58
But we have now thrown the coin two hundred times, and… It came up tails 100 times. Is it a fair coin?

59
Perfectly fair The probability of rejecting the null hypothesis is ZERO!!

60
Suppose we project a Poggendorf figure to one side of the brain or to the other…. and measure error.

61
Paired Samples Statistics MeanNStd. Error Mean Pair 1Right5.416712.70128 Left4.916712.62107 t(11) = 2.17, p = 0.053 What do you conclude?
 = 2.17, p = What do you conclude .")
62
Paired Samples Statistics MeanNStd. Error Mean Pair 1Right5.416712.70128 Left4.916712.62107 t(11) = 2.17, p = 0.053 Now suppose you did this again with another sample of 12 people. t(11) = 2.10, p = 0.057
 = 2.17, p = Now suppose you did this again with another sample of 12 people. t(11) = 2.10, p =")
63
But the probability of independent events is: p(A) X p(B) so that: The Null hypothesis probability for both studies was: 0.053 X 0.057 = 0.003 What do you conclude now?
 X p(B) so that: The Null hypothesis probability for both studies was: X = What do you conclude now")
64
But if the brain hemispheres are truly independent…. Then...

65
Paired Samples Statistics MeanNStd. Error Mean Pair 1Right5.416712.70128 Left4.916712.62107 t(22) = 0.53, p = 0.60 What do you conclude now?
 = 0.53, p = 0.60 What do you conclude now .")
Similar presentations