Download presentation
Presentation is loading. Please wait.

1
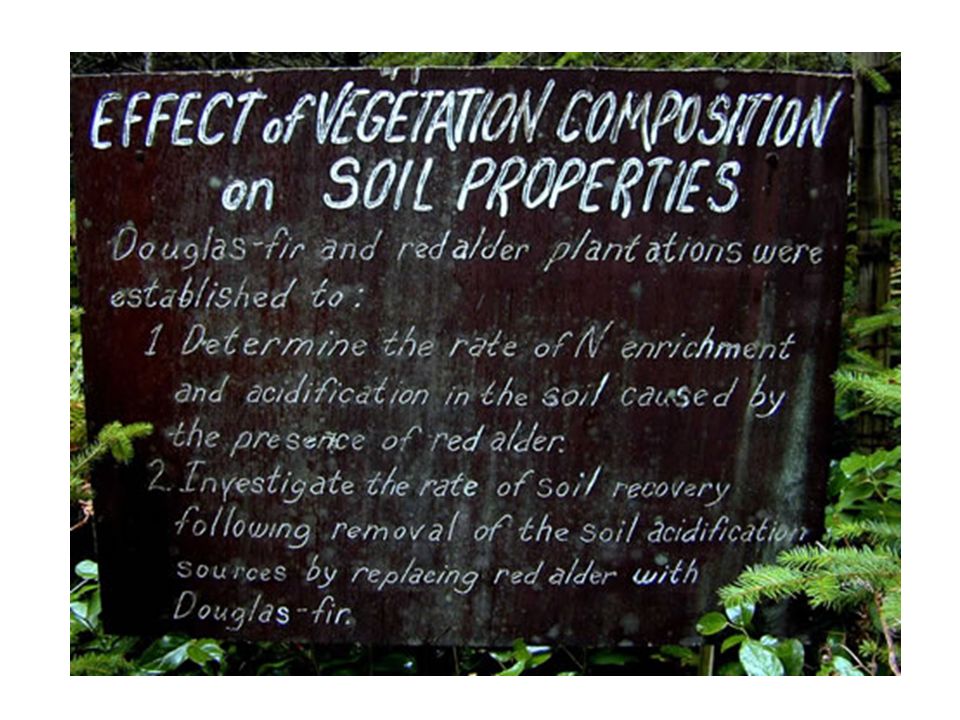
ESRM 410 Forest Soils and Site Productivity 2013 Nutrient Limitation ‘What if Scenario’

2
Cedar River Watershed – plots just located upstream of ‘you are here’ pointer

3
This slide and some following contain the design, stand characteristics and initial growth results. Please concentrate on explaining factors that might have led to: the differential growth of Douglas-fir vs. red alder on each site and also the differential growth of each species on different initial site Figure 1. Layout of study.

5
Alder replanted with Alder

6
DF replanted with DF

7
Alder replanted with DF

8
DF replanted with Alder

9
Table 1.

10
Table 2. Stand C distribution in the 50-yr-old Douglas fir and red alder stands. Tree and understory C concentrations were assumed to be 500 mg C kg-1. Where possible from sampling procedure, variability between plots was assessed and means compared via two-tailed two-sample t-test (Freund, 1988).
..")
11
Figure 2. Growth of new plantations. DF - DF DF - RA RA - DF RA - RA

12
Please concentrate on explaining factors that might have led to: – the differential growth of Douglas-fir vs. red alder on each site, and also – the differential growth of each species on different initial site So, the these groups will respond to the above questions with the following comparisons: (many other comparisons can be made but just concentrate on answering the questions related to these forest plots) Group 1 will compare = RA-RA vs. DF-RA Group 2 will compare = RA-DF vs. DF-DF Figure 1. Layout of study.
 Group 1 will compare = RA-RA vs. DF-RA Group 2 will compare = RA-DF vs. DF-DF Figure 1. Layout of study..")
Similar presentations


>")


