Download presentation
Presentation is loading. Please wait.

1
Type author names here Social Research Methods Chapter 16: Using IBM SPSS for Windows (part 2) Alan Bryman Slides authored by Tom Owens
 Alan Bryman Slides authored by Tom Owens")
2
Bryman: Social Research Methods, 4 th edition When you click OK in Chart Builder, the graph is sent to the Output Viewer.... with a result like this:

3
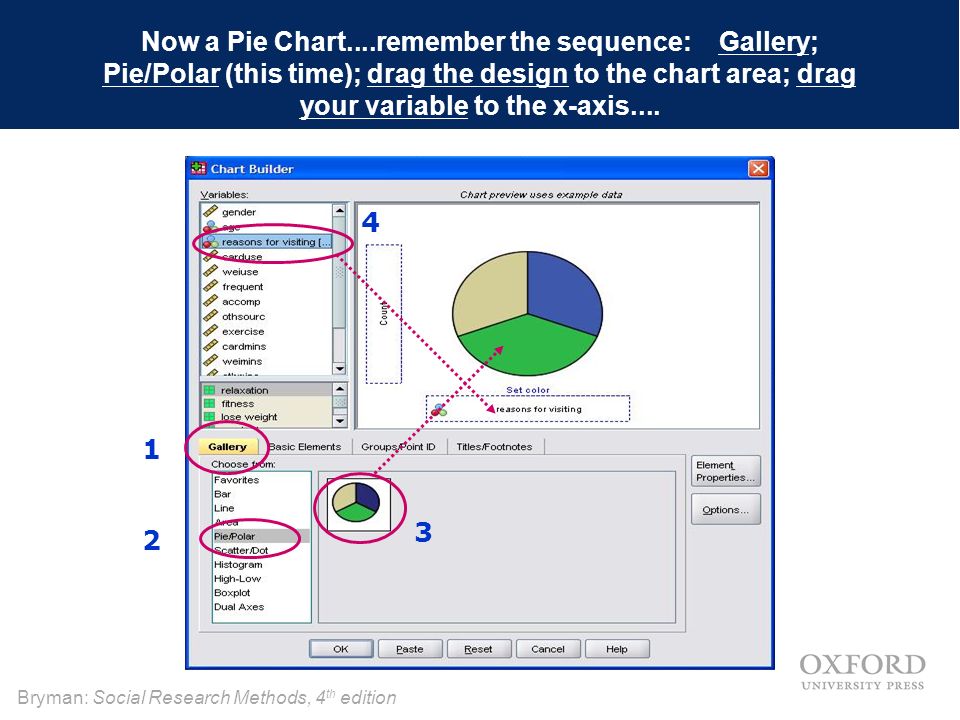
Bryman: Social Research Methods, 4 th edition Now a Pie Chart....remember the sequence: Gallery; Pie/Polar (this time); drag the design to the chart area; drag your variable to the x-axis.... 1 2 3 4
4
Bryman: Social Research Methods, 4 th edition See page 365 This time, click anywhere in the chart in Output Viewer to get the Chart Editor, then click Elements for Data Labels......

5
Bryman: Social Research Methods, 4 th edition This is the (familiar) sequence to generate......a Histogram: 1 2 3 4
 sequence to generate......a Histogram:")
6
Bryman: Social Research Methods, 4 th edition The resulting graph will look something like this:

7
Bryman: Social Research Methods, 4 th edition Generating the Arithmetic Mean, Median, Standard Deviation, and Range Click Analyse on the toolbar, select Descriptive Statistics from the drop-down menu, select Explore to open a new dialog box (like the Frequencies box we had earlier). This time, choose age as the variable for analysis, as we did for the histogram, click the Statistics button in the dialog box and OK. See page 363

8
Bryman: Social Research Methods, 4 th edition The resulting display will look like this: Table 16.1, page 365

9
Bryman: Social Research Methods, 4 th edition Bivariate analysis: Generating a contingency table Now we can go deeper into the data, to find correlations and perhaps causality within the variables. For this example, we will examine the possible relationship between reasons for visiting the gym and gender. First, click Analyse on the toolbar, and Descriptive Statistics on the drop-down menu as before, but this time, open the Crosstabs dialog box...... See page 365

10
Bryman: Social Research Methods, 4 th edition Follow the sequence carefully.... 1 2 3 4 Plate 16.13, Page 373

11
Bryman: Social Research Methods, 4 th edition Cell Display selections: Plate 16.14 page367

12
Bryman: Social Research Methods, 4 th edition Statistics selections: Plate 15.15 page 375

13
Bryman: Social Research Methods, 4 th edition The result will be a Contingency Table for Reasons for Visiting by Gender: Table 16.2, page 369

14
Bryman: Social Research Methods, 4 th edition Contingency Table for Reasons for Visiting by Gender (cont’d): Table 16.2, page 369
: Table 16.2, page 369")
15
Bryman: Social Research Methods, 4 th edition Bivariate Analysis: Correlation Some variables are ordered by rank, rather than absolute value, as we have seen earlier. These Ordinal or Interval/Ratio variables can also be investigated for correlation, using Pearson’s r (for comparison of two Interval/Ratio variables), Spearman’s rho for comparison between Ordinals or between Ordinals and Interval/Ratio variables, or Kendall’s tau between Ordinals. The most frequently used are Pearson and Spearman, often in combination. To perform this analysis in SPSS, click Analyse on the toolbar, Correlate on the drop-down menu and then open the Bivariate Correlations dialog box.
, Spearman’s rho for comparison between Ordinals or between Ordinals and Interval/Ratio variables, or Kendall’s tau between Ordinals. The most frequently used are Pearson and Spearman, often in combination. To perform this analysis in SPSS, click Analyse on the toolbar, Correlate on the drop-down menu and then open the Bivariate Correlations dialog box..")
16
Bryman: Social Research Methods, 4 th edition Plate 16.16, page 370 For this example, we will test for correlations between age, time spent on cardiovascular equipment (cardmins) and time spent on weights equipment (weimins)
 and time spent on weights equipment (weimins)")
17
Bryman: Social Research Methods, 4 th edition The result will be the calculation of Correlations for age, cardmins, and weimins Table 16.3, page 370

18
Bryman: Social Research Methods, 4 th edition Generating Scatter Diagrams If we want to show a relationship visually, for example of that between age and time spent on cardiovascular equipment (cardmins), we could produce a scatter diagram. Click Graphs on the toolbar and open the Chart Builder

19
Bryman: Social Research Methods, 4 th edition The chart-building sequence is almost like before, using two of our variables instead of one 1 2 3 5 4

20
Bryman: Social Research Methods, 4 th edition The result will look something like this: Now you can use the Chart Editor to refine the diagram, inserting lines of fit and labelling outlying values. Figure 16.1

21
Bryman: Social Research Methods, 4 th edition In this illustration, a best-fit line and a line of interpolation have been inserted, to help with interpretation

22
Bryman: Social Research Methods, 4 th edition A Final Word: Save your work regularly. SPSS will remind you that closing certain windows will terminate that session but it will not save active work before shutting down. You can save all your outputs in one file for later editing. Remember the old saying: Garbage in means garbage out. SPSS is a powerful tool but it cannot transform bad data into a good report, nor can it correct errors in recording the data. Keep all your data files after your dissertation is printed. You will probably need to submit these on compact disk and you may be asked to produce them during a defence.

Similar presentations


 Using SPSS for Windows Graziano and Raulin Research Methods This multimedia product and its contents are protected under.>")


>")


 Kentaka Aruga.>")
 Jawaharlal Nehru University (JNU) New Delhi India>")