Download presentation
Presentation is loading. Please wait.

1
Analysis of Variance ANOVA

2
Example Suppose that we have five educational levels in our population denoted by 1, 2, 3, 4, 5 We measure the hours per week that each level watches TV and we repeat this experiment for 6 weeks. So we will enter our data in the following table

3
Week 1Week 2Week 3Week 4Week 5Week 6 1202318293023 224 293119 33125 262028 42729 341927 5232934322729

4
We want to know that whether educational level affect on the weekly hours watching TV or not. So we define this hypothesis

5
For testing this hypothesis we use ANOVA in SPSS by using following order 1- Entering data in the variable view 2- Analyze 3- Compare Means 4- One-Way ANOVA

10
Correlation

11
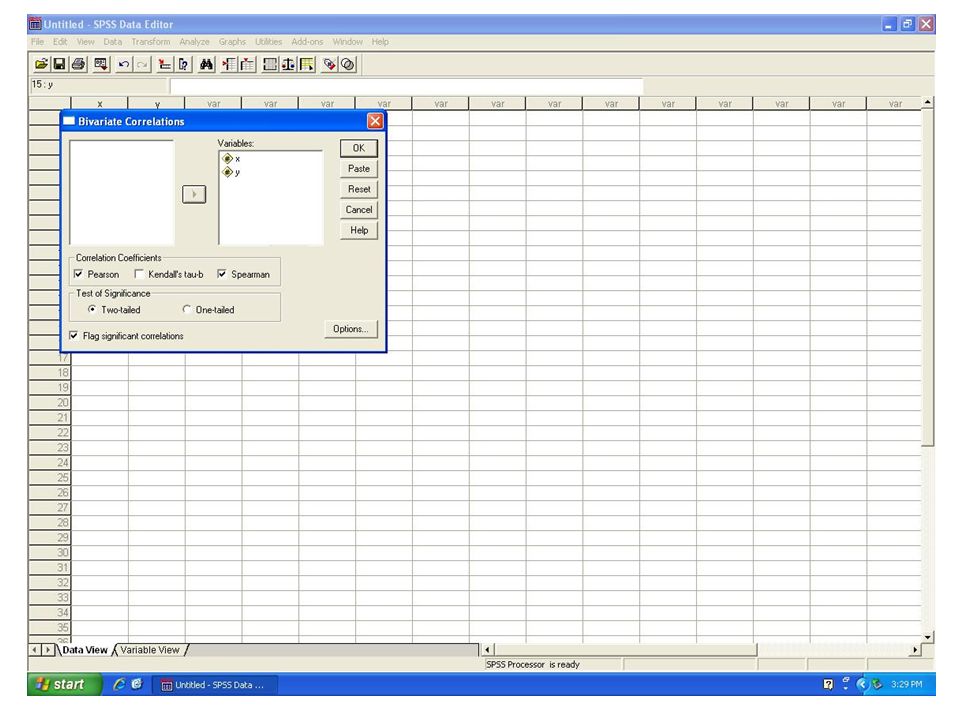
In this part we are going to calculate the Correlation between two variables In SPSS we can get the Correlation Coefficients between two variables like -Pearson Correlation Coefficient -Spearman Correlation Coefficient

12
For getting these coefficients we use this order in SPSS 1- Entering data in variable view 2- Analyze 3- Correlate 4-Bivariate Correlation

13
Example XY 1232 1424 1334 2632 2333 1526 1828 XY 2030 1931 1925 1827 1826 2226 2530

18
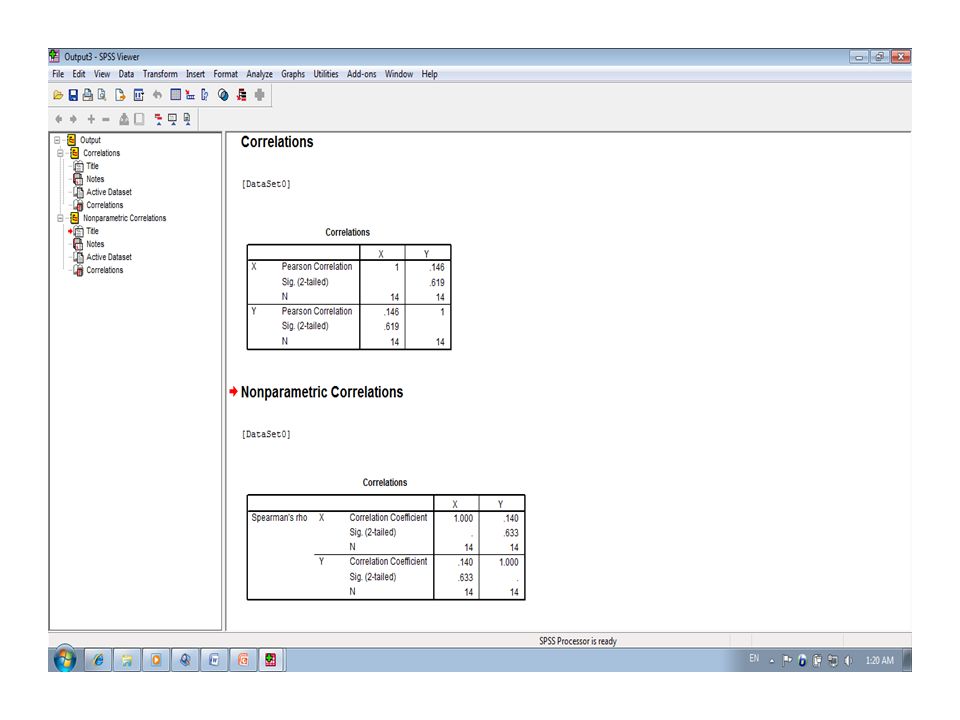
Results If correlation coefficient between two variables is 1 or near to 1, they are dependent. If it is zero or near to zero, they are independent. So, in this example X & Y are independent

Similar presentations


 Y (WT)............................. The Graphical View– A Scatter Diagram X’ Y’>")


 Using SPSS for Windows Graziano and Raulin Research Methods This multimedia product and its contents are protected under.>")


 Type of Categorization One Categorical Variable Chi-Square – Goodness-of-Fit Two Categorical Variables.>")


