Download presentation
Presentation is loading. Please wait.

1
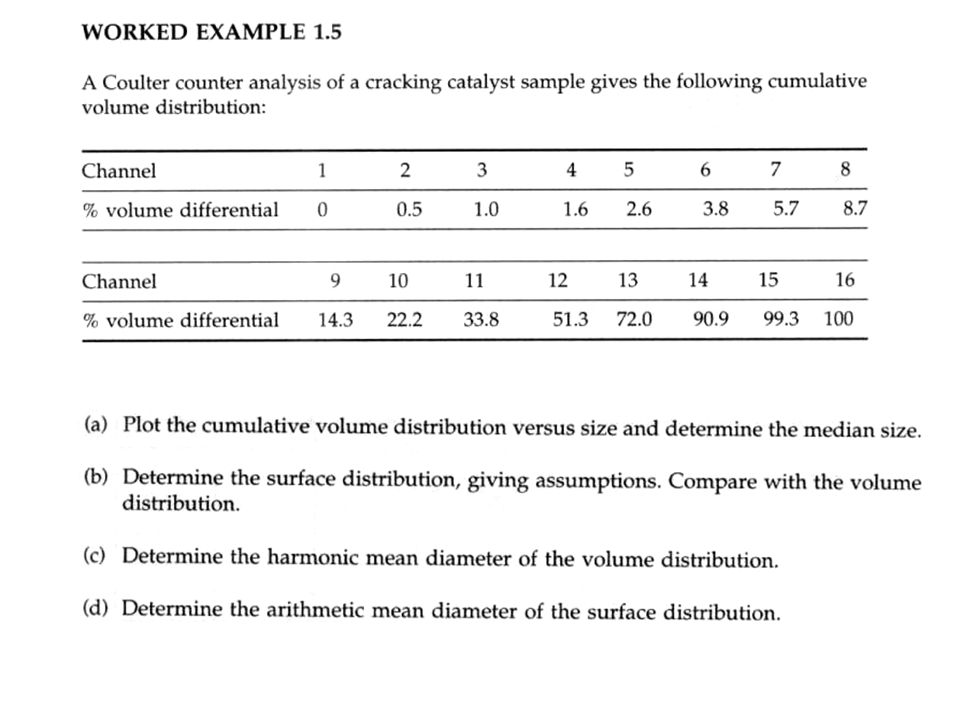
Week # 1 MR Chapter 1 Tutorial #1
To be discussed on Jan By either volunteer or class list. MARTIN RHODES (2008) Introduction to Particle Technology , 2nd Edition. Publisher John Wiley & Son, Chichester, West Sussex, England.
 Introduction to Particle Technology , 2nd Edition. Publisher John Wiley & Son, Chichester, West Sussex, England.")
2
Describing the size of a single particle
Describing the size of a single particle. Some terminolgy about diameters used in microscopy. Equivalent circle diameter. Martin’s diameter. Feret’s diameter. Shear diameter.

3
Describing the size of a single particle
Regular-shaped particles The orientation of the particle on the microscope slide will affect the projected image and consequently the measured equivalent sphere diameter. Sieve measurement: Diameter of a sphere passing through the same sieve aperture. Sedimentation measurement: Diameter of a sphere having the same sedimentation velocity under the same conditions. Comparison of equivalent sphere diameters.

4
Comparison of equivalent diameters
The volume equivalent sphere diameter is a commonly used equivalent sphere diameter. Example: Coulter counter size measurement. The diameter of a sphere having the same volume as the particle. Surface-volume diameter is the diameter of a sphere having the same surface to volume ratio as the particle. (Example) Shape Cuboid Cylinder Cuboid: side lengths of 1, 3, 5. Cylinder: diameter 3 and length 1.
 Shape. Cuboid. Cylinder. Cuboid: side lengths of 1, 3, 5. Cylinder: diameter 3 and length 1.")
5
Description of populations of particles
Typical differential frequency distribution F: Cumulative distribution, integral of the frequency distribution.

6
Typical cumulative frequency distribution

7
Comparison between distributions
For a given population of particles, the distributions by mass, number and surface can differ dramatically. All are smooth continuous curves. Size measurement methods often divide the size spectrum into size ranges, and size distribution becomes a histogram. Comparison between distributions

8
Conversion between distributions
Mass and number distributions for man-made objects orbiting the earth

9
Total number of particles, N and total surface area S are constant.
Particle shape is independent of size, as is constant. V is the total volume of the particle population and av is the factor relating the linear dimension of particle to its volume.

11
Assumptions for conversions among different distribution functions
It is necessary to make assumptions about the constancy of shape and density with size. Calculation errors are introduced into the conversions. Example: 2% error in FN results in 6% error in FM. (Recalling the relationship between mass and diameter). If possible, direct measurements be made with the required distribution.
. If possible, direct measurements be made with the required distribution.")
12
Describing the population by a single number
Definitions of means

13
Plot of cumulative frequency against weighting function g(x)
Plot of cumulative frequency against weighting function g(x). Shaded area is Number-length mean: Arithmetic mean of the number distribution conserves the number and length of population.
. Shaded area is. Number-length mean: Arithmetic mean of the number distribution conserves the number and length of population.")
14
Comparison between measures of central tendency
Comparison between measures of central tendency. Adapted from Rhodes (1990). Surface-volume mean, Sauter mean: Arithmetic mean of surface distribution conserves the surface and volume of population. The values of the different expressions of central tendency can vary significantly. Two quite different distributions could have the same arithmetic mean or median.
. Surface-volume mean, Sauter mean: Arithmetic mean of surface distribution conserves the surface and volume of population. The values of the different expressions of central tendency can vary significantly. Two quite different distributions could have the same arithmetic mean or median.")
15
Equivalence of means Ks and Kv do not vary with size Same Expression

16
Common methods of displaying size distributions
Arithmetic-normal Distribution Log-normal Distribution z: Arithmetic mean of z, sz: standard deviation of log x Arithmetic-normal distribution with an arithmetic mean of 45 and standard deviation of 12.

17
Log-normal distribution plotted on linear coordinates
Log-normal distribution plotted on logarithmic coordinates

18
Methods of particle size measurements: Sieving
Sieving: Dry sieving using woven wire sieves is appropriate for particle size greater than 45 mm. The length of the particle does not hinder it passage through the sieve aperture. Most common modern sieves are in sizes such that the ratio of adjacent sieve sizes is the fourth root of two (e.g. 45, 53, 63, 75, 90, 107 mm).
.")
19
Methods of particle size measurements: Microscopy
The optical microscope may be used to measure particle size down to 5 mm. The electron microscope may be used for size analysis below 5 mm. Coupled with an image analysis system, the optical and electron microscopy can give number distribution of size and shape. For irregular-shaped particles, the projected area offered to the viewer can vary significantly. Technique (e.g. applying adhesive to the microscope slide) may be used to ensure “random orientation”.
 may be used to ensure random orientation .")
20
Methods of particle size measurement
Rep <0.3. Motion of the particle obeys Stoke’s law. The suspension is sufficiently dilute (No hindered settling). Particles are assumed to accelerate rapidly to their terminal free fall velocity, time for acceleration is negligible. Sedimentation Size analysis by sedimentation
. Particles are assumed to accelerate rapidly to their terminal free fall velocity, time for acceleration is negligible. Sedimentation. Size analysis by sedimentation.")
21
Permeametry See Example 1.3 Co: original uniform suspension density.
Sampling point: C at time t after the start of settling. At time t all particles traveling faster than h/t will have fallen below the sampling point. C represents the suspension density for all particles which travel at a velocity <= h/t. Permeametry See Example 1.3 The diameter calculated from the Carman-Kozeny equation is the arithmetic mean of the surface distribution.

22
Electrozone sensing Schematic of electrozone sensing apparatus
As particle flow through the orifice, a voltage pulse is recorded. The amplitude of the pulse can be related to the volume of particle the orifice. Particle range: mm. Schematic of electrozone sensing apparatus

Similar presentations


 Introduction.>")


 Tutorial 7.>")
 is measured with a series of standard screens. The size of a crystal is taken to be the average of the screen openings.>")
 Tutorial 6 FLUID KINETMATICS.>")
 is the magnetic flux: Units of flux are Webers. Tesla/m.>")

