Download presentation
Presentation is loading. Please wait.

1
1 Oklahoma State University Corn &Wheat Situation and Outlook Corn &Wheat Situation and Outlook Kim B. Anderson

2
2 Kim’s Web site agecon.okstate.edu/anderson “Other articles” agecon.okstate.edu/anderson “Other articles”

3
3 Policy comes and policy goes but weather determines prices. Luther Tweeten Policy comes and policy goes but weather determines prices. Luther Tweeten

4
4 Corn production area

5
5 Soybean production area

6
6 Cotton production area

7
7 HRW wheat production area

8
8 SRW wheat production area

9
9 Corn

10
10 CornusedforEthanol billion bushels) Corn used for Ethanol (billion bushels) ’07/08 3.2 bb ’08/09 4.0 bb ’09/10 4.3 bb ’06/07 2.1 bb
 Corn used for Ethanol (billion bushels) ’07/ bb ’08/ bb ’09/ bb ’06/ bb")
11
11 U.S. Corn Situation (Billion Bushels)(Million Bushels) Planted Acres Harvested Acres Yield Production Year 200079.672.4 (91.0) 136.910.0 200175.768.8 (90.9) 138.29.5 200278.969.3 (87.8) 129.39.0 200378.670.9 (90.2) 142.210.1 200480.973.6 (91.0) 160.411.8 200581.875.1 (91.8) 148.011.1 200678.370.7 (90.3) 149.110.5 200793.686.1 (92.0) 154.713.2 7-YR Avg. 79.1143.410.371.5 Percentage harvested in parenthesizes
(Million Bushels) Planted Acres Harvested Acres Yield Production Year (91.0) (90.9) (87.8) (90.2) (91.0) (91.8) (90.3) (92.0) YR Avg Percentage harvested in parenthesizes.")
12
12 U.S. Corn Situation ProductionConsumption Ending Stocks U. S. Price Year (Billion Bushels) 200010.09.62.1$1.82 20019.59.81.6$1.85 20029.09.51.0$1.97 200310.110.21.0$2.30 200411.810.62.2$2.42 200511.1 2.0$2.06 200610.511.41.3$3.00 200713.212.61.9$3.50 7-YR Avg. 10.3 1.6$2.20
 $ $ $ $ $ $ $ $ YR Avg $2.20.")
13
13 World Corn Situation ProductionConsumption Ending Stocks Year (Billion Bushels) 200023.223.86.0 200123.624.55.8 200223.724.74.9 200324.325.54.1 200427.826.95.1 200527.3 4.8 200627.628.54.1 200730.330.13.9 7-YR Avg. 25.425.94.8

14
14 2008 Corn Production 2007 use + ethanol increase – 1 bb ending stocks = required production ÷ yield = acres harvested ÷ % harvested = required planted acres 12.6 bb + 0.7 bb – 1 bb = 12.3 bb ÷ 153 bu/ac = 80 ma ÷.91 = 88 million acres

15
15 CBT Corn Monthly Nearest Before ethanol Weather Ethanol

16
16 U.S. Corn Situation (Billion Bushels) 06/07 Month 07/08 Ending Stocks (Cents per Bushel) (± 30) USDA Cash Est. Price Range Open/Close CBT Nearby May0.9370.947345-390345-395340 June0.9370.997388-329323-426340 July1.1371.502332-326308-344310 Aug1.516326-324310-354310 Sept1.675327-373320-390310 Oct1.997375-372335-376320 Nov1.897374-379367-390350
 06/07 Month 07/08 Ending Stocks (Cents per Bushel) (± 30) USDA Cash Est. Price Range Open/Close CBT Nearby May June July Aug Sept Oct Nov")
17
17 Key points 2007 corn production 13.2 billion bushels (bb). 2007 corn use 12.6 bb. 2007 ethanol corn use 3.2 bb. 2008 projected ethanol corn use 3.9 bb. corn end stocks ~ 1.9 bb $3.50 avg. annual price. corn end stocks < 1.0 bb $3.50 avg. annual price. 2008 planted acres 88 mil., production of 12.3 bb, ending stocks 1.0 bb & $3.70 avg. annual price.

18
18 Wheat

19
19 U.S. Wheat Situation (Billion Bushels)(Million Bushels) Planted Acres Harvested Acres Yield Production Year 200062.553.1 (85.0) 42.02.23 200159.448.5 (81.6) 40.21.95 200260.345.8 (76.0) 35.01.61 200362.153.1 (85.5) 44.22.34 200459.750.0 (83.8) 43.22.26 200557.250.1 (87.6) 42.02.10 200657.346.8 (81.7) 38.71.81 200760.451.0 (84.4) 40.52.07 7-YR Avg. 59.940.72.0049.8 (83.2) Percentage harvested in parenthesizes
(Million Bushels) Planted Acres Harvested Acres Yield Production Year (85.0) (81.6) (76.0) (85.5) (83.8) (87.6) (81.7) (84.4) YR Avg (83.2) Percentage harvested in parenthesizes.")
20
20 ProductionConsumption Ending Stocks U. S. Price Year (Billion Bushels) U.S. Wheat Situation 20002.232.39.873$2.62 20011.502.15.777$2.78 20021.611.99.492$3.56 20032.342.35.546$3.40 20042.162.24.540$3.40 20052.112.16.571$3.42 20061.802.05.456$4.26 20072.072.30.312$6.10 7-YR Avg. 1.962.19.608$3.35

21
21 World Wheat Situation (Billion Bushels) ProductionConsumption Ending Stocks Year 200021.421.57.4 200121.321.57.4 200220.822.26.2 200320.421.64.8 200423.022.35.5 200522.923.15.4 200621.822.74.6 200722.122.64.0 7-YR Avg. 21.722.15.9

22
22 KCBT Monthly Nearest Before ethanol Weather Ethanol

23
23 KCBT March ‘08

24
24 KCBT July “08

25
25 U.S. Wheat Situation (Billion Bushels) 06/07 USDA Cash Est. Month 07/08 Ending Stocks (Cents per Bushel) (± 30) Price Range Open/Close KCBT Nearby May412469480-504462-512465 June417443504-597500-630480 July456418604-629573-657510 Aug404629-721617-733540 Sept362751-929751-950580 Oct307947-827815-950610 Nov312831-777770-835610
 (± 30) Price Range Open/Close KCBT Nearby May June July Aug Sept Oct Nov")
26
26 U.S. Wheat Supply and Use Beginning stocks Production Supply, Total Exports Use, Total Ending Stocks Avg. farm price 307 2,350 2,657 1,050 2,250 407 $5.20 million bushels Kim’s 08/09 456 2,067 2,608 1,150 2,301 307 $6.10 USDA 07/08

27
27 KCBT July wheat contract price $6.92 Elevator forward contract basis -$0.53 Forward contract offer $6.39 Buy KCBT July 690 call -$0.70 FC/Call minimum price $5.69 Buy KCBT July 690 Put (690¢ - 70¢) $6.20 Expected June 2008 basis -$0.45 Expected minimum price $5.75 June 2008 wheat delivery prices
 $6.20 Expected June 2008 basis -$0.45 Expected minimum price $5.75 June 2008 wheat delivery prices")
28
28 Key Points Weather is the major price factor. Corn continues to set the floor for wheat prices. U.S. and world wheat stocks below average. Wheat planted acres increase ~5% (63 ma). Wheat stocks increase in 2008/09 – below avg. 2008/09 wheat price range $3.75 to $8.50. June 2008 wheat price ~ $5.80 $4.50 to $8.50.
. Wheat stocks increase in 2008/09 – below avg. 2008/09 wheat price range $3.75 to $8.50. June 2008 wheat price ~ $5.80 $4.50 to $")
29
29 Kim’s Web site agecon.okstate.edu/anderson

30
30

31
31 Kim’s rules for marketing Keep it simple Make a plan Write the plan down Have the discipline to follow the plan Do not—ever, ever—listen to market outlook economists.

32
32 Sorghum

33
33 U.S. Sorghum Situation (Million Bushels) ProductionConsumption Ending Stocks U. S. Price Year 200047051520$1.80 200151549561$1.94 200236137943$2.35 200341142134$2.39 200445542257$1.79 200539338466$1.80 200627830538$3.30 200750147559$3.00 7-YR Avg. 41241746$2.20

34
34 (Million Bushels) Foreign Sorghum Situation ProductionConsumption Ending Stocks Year 20001.651.910.11 20011.782.000.13 20021.721.920.11 20031.882.040.15 20041.812.030.11 20051.912.100.11 20061.982.100.14 20071.981.820.12 7-YR Avg. 1.822.020.12

35
35 (Million Bushels) World Sorghum Situation ProductionConsumption Ending Stocks Year 2000471.6516.920.1 2001516.8497.061.1 2002362.7380.943.1 2003412.9423.034.1 2004456.8424.057.1 2005394.9386.166.1 2006280.0307.138.1 2007503.0477.259.1 7-YR Avg. 413.7419.345.7

36
36 Key Point Sorghum prices follow corn prices

37
37 Cotton

38
38 U.S. Cotton Situation ProductionConsumption Ending Stocks U. S. Price Year (Million Bales) 200017.215.66.049.9 ¢ 200120.318.77.529.8 ¢ 200217.219.25.444.5 ¢ 200318.320.33.561.8 ¢ 200423.319.77.142.8 ¢ 200523.9 6.147.7 ¢ 200621.618.09.747.3 ¢ 200718.521.36.444.9 ¢ 7-YR Avg. 20.319.36.546.3 ¢
 ¢ ¢ ¢ ¢ ¢ ¢ ¢ ¢ 7-YR Avg ¢.")
39
39 World Cotton Situation ProductionConsumption Ending Stocks Year (Million Bales) 200088.792.242.4 200198.594.547.2 200288.398.538.1 200395.198.640.2 2004120.2108.050.6 2005115.7116.457.6 2006119.3122.757.9 2007120.3129.555.0 7-YR Avg. 103.7104.447.7

40
40 Cotton Relevant Numbers Current Projections Average Million Bales U.S. Ending Stocks World Ending Stocks

41
41 U.S. and world cotton stocks above average. Cotton acreage planted to beans and corn. Prices expected to average 55 cents. Key points

42
42

43
43 Soybean

44
44 U.S. Soybeans Situation (Billion Bushels)(Million Bushels) Planted Acres Harvested Acres Yield Production Year 200074.372.4 (97.4) 38.12.76 200174.173.0 (98.5) 39.62.89 200274.072.5 (98.1) 38.02.76 200373.472.5 (98.8) 33.92.45 200475.274.0 (98.4) 42.23.12 200572.171.3 (98.9) 43.03.06 200675.574.6 (98.8) 42.73.19 200763.762.8 (98.6) 41.42.60 7-YR Avg. 72.8143.410.371.5 (98.4) Percentage harvested in parenthesizes
(Million Bushels) Planted Acres Harvested Acres Yield Production Year (97.4) (98.5) (98.1) (98.8) (98.4) (98.9) (98.8) (98.6) YR Avg (98.4) Percentage harvested in parenthesizes.")
45
45 U.S. Soybean Situation (Billion Bushels) ProductionConsumption Ending Stocks U. S. Price Year 20002.8 0.25$4.54 20012.9 0.21$4.38 20022.8 0.18$5.53 20032.5 0.11$7.34 20043.12.90.36$5.65 20053.12.80.50$5.66 20063.23.10.58$6.40 20072.63.00.22$8.00 7-YR Avg. 2.92.80.31$5.64

46
46 ProductionConsumption Ending Stocks Year Foreign Soybean Situation (Billion Bushels) 20003.63.50.9 20013.9 1.0 20024.44.21.3 20034.44.51.3 20045.14.61.7 20055.0 1.5 20065.55.21.8 20075.55.61.6 7-YR Avg. 4.74.41.3

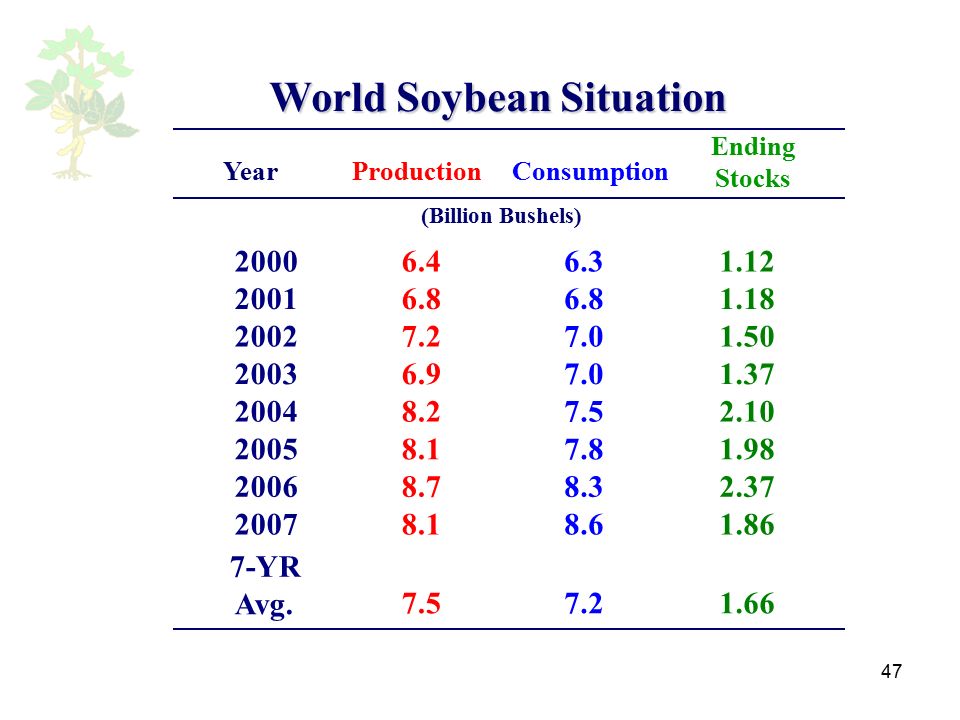
47
47 ProductionConsumption Ending Stocks Year World Soybean Situation (Billion Bushels) 20006.46.31.12 20016.8 1.18 20027.27.01.50 20036.97.01.37 20048.27.52.10 20058.17.81.98 20068.78.32.37 20078.18.61.86 7-YR Avg. 7.57.21.66
48
48 CBT Soybeans Monthly Nearest Before ethanol & bio-diesel Weather Ethanol & bio-diesel

49
49 U.S. Soybean Situation (Million Bushels) 06/07 USDA Cash Est. Month 07/08 Ending Stocks (Cents per Bushel) (± 50) Price Range Open/Close CBT Nearby May610320726-806725-816700 June610320806-850792-876720 July600245863-834810-915775 Aug575220840-868789-880775 Sept555215881-991875-1017785 Oct573215996 -996923-1007835
 (± 50) Price Range Open/Close CBT Nearby May June July Aug Sept Oct")
50
50 Soybean Relevant Numbers Current Projections Average Billion Bushels U.S. Ending Stocks World Ending Stocks 0.22 1.860.311.66

51
51 Key points U.S. soybean stocks below average. World soybean stocks above average. Expect Brazil to increase production. Increased 2008 planted acres (70 ma) Prices remain above average.
 Prices remain above average..")
52
52 Key points Ending stocks ~225 mb $9 - $10 Ending stocks ~600 mb $7

Similar presentations


 257-2996>")


