Download presentation
Presentation is loading. Please wait.

1
Pat Westhoff (westhoffp@missouri.edu)westhoffp@missouri.edu FAPRI-MU director University of Missouri www.fapri.missouri.edu Farm Bill Decision Aid Training Memphis, Tennessee September 25, 2014

2
FAPRI-MU crop market outlook Price projections Farm commodity supply and use that generate those prices Uncertainty around the projections Why prices matter in making program choices

5
FAPRI-MU has been making market projections for 30 years Complex models of U.S. and world markets + analyst expertise DC review of models and projections each December Annual baseline released in early March Updates August update each year For this project, monthly updates—September is first official Reflect new information on crop production, demand, etc. We know actual prices will differ We solve for 500 different futures given different assumptions

7
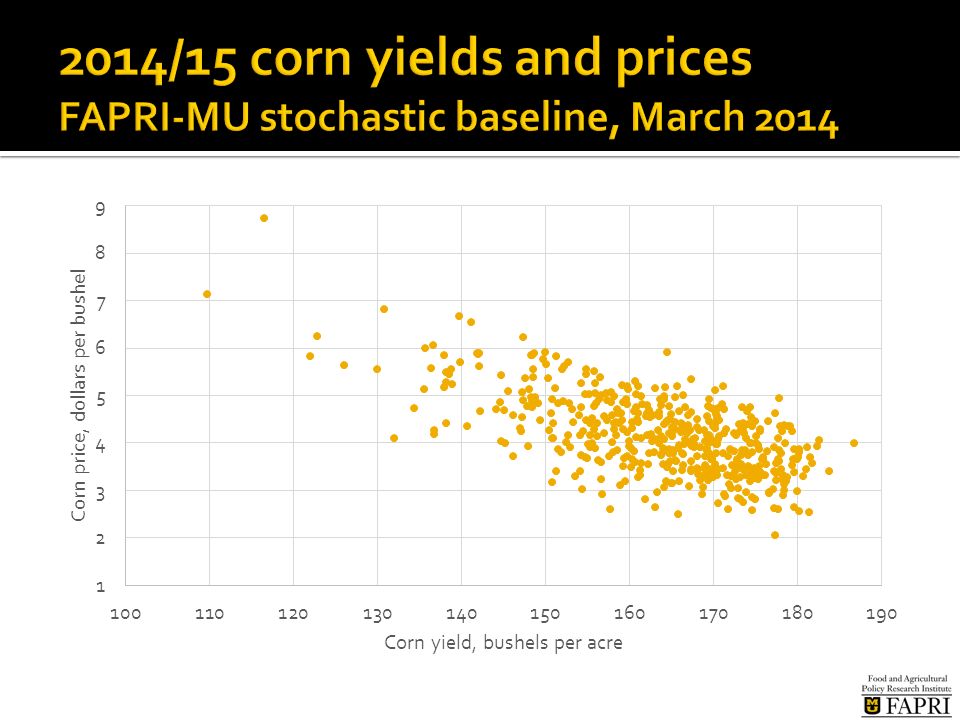
Avg. of March estimates: 163.5 bu./a. and $4.17/bu.

8
September USDA estimates: 171.9 bu./a. and $3.50/bu. Avg. of March estimates: 163.5 bu./a. and $4.17/bu.

9
Economic growth, exchange rates, etc. Policy (generally keep current policies) Technology (generally trend growth in crop yields, etc.) Economic choices by producers and consumers Weather and other factors that make markets volatile
 Technology (generally trend growth in crop yields, etc.) Economic choices by producers and consumers Weather and other factors that make markets volatile.")
10
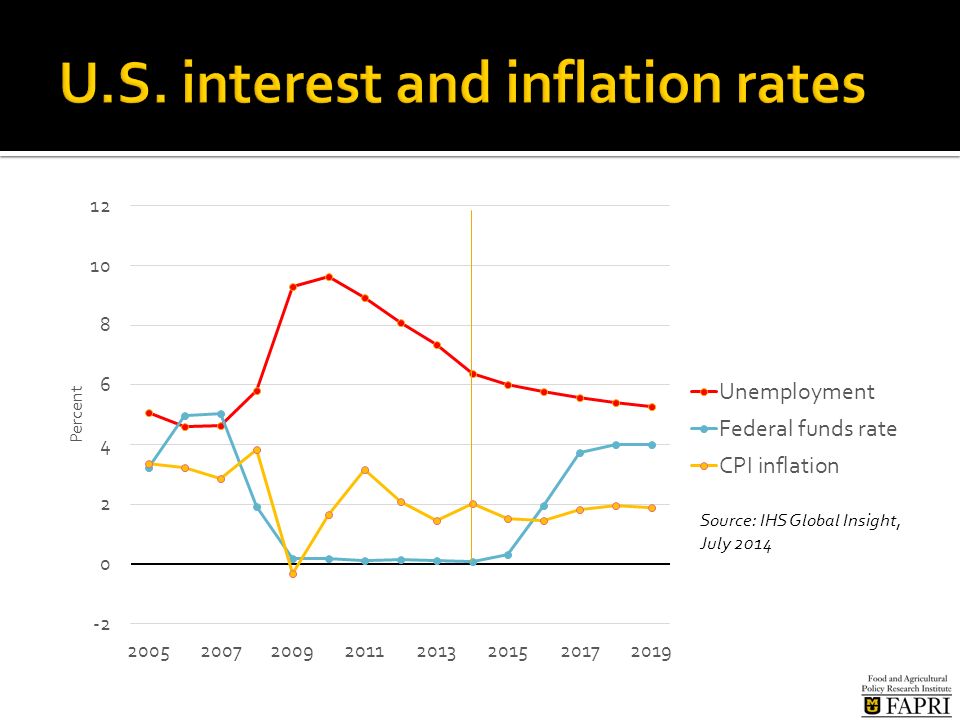
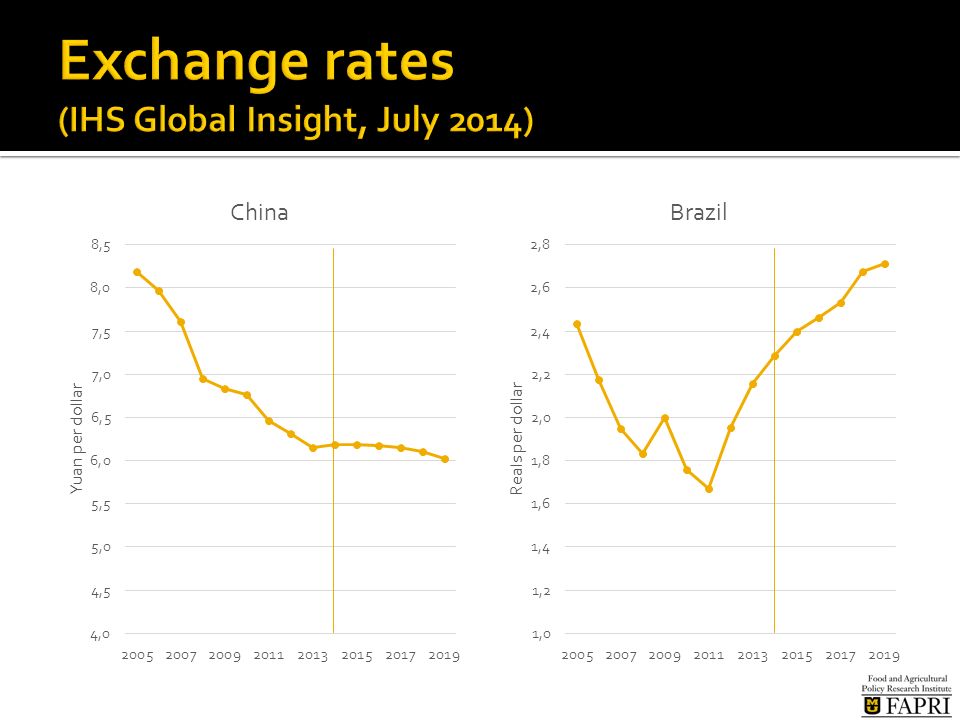
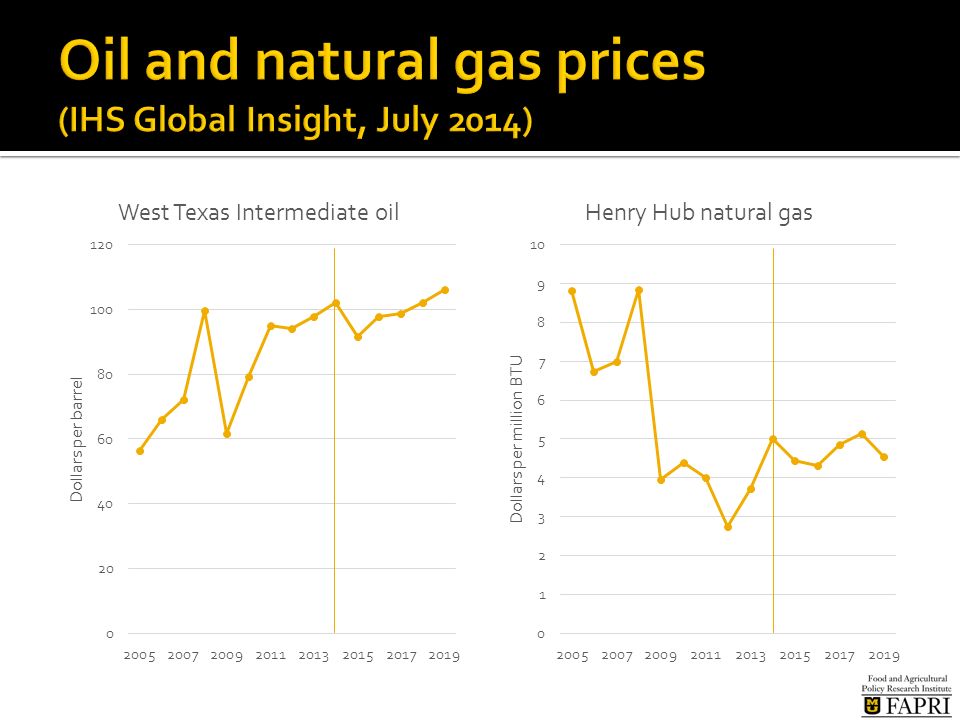
Source: IHS Global Insight, July 2014

16
2012/132013/142014/15 Planted area (mil. a.) 97.2 95.4 91.6 Harvested area (mil. a.) 87.4 87.7 83.8 Yield (bu./a.)123.4158.8171.7 Production (mil. bu.)10,78013,92514,395 Feed & residual (mil. bu.) 4,339 5,175 5,325 Ethanol & coproducts (mil. bu.) 4,641 5,125 Other domestic use (mil. bu.) 1,398 1,375 1,405 Exports (mil. bu.) 730 1,925 1,750 Ending stocks (mil. bu.) 821 1,181 2,002 Farm price per bushel$6.89$4.45$3.20-$3.80
 Yield (bu./a.) Production (mil. bu.)10,78013,92514,395 Feed & residual (mil. bu.) 4,339 5,175 5,325 Ethanol & coproducts (mil. bu.) 4,641 5,125 Other domestic use (mil. bu.) 1,398 1,375 1,405 Exports (mil. bu.) 730 1,925 1,750 Ending stocks (mil. bu.) 821 1,181 2,002 Farm price per bushel$6.89$4.45$3.20-$3.80.")
18
Source: Unpublished FAPRI-MU projections, Sep. 2014

20
2012/132013/142014/15 Planted area (mil. a.)77.276.5 84.8 Harvested area (mil. a.)76.275.9 84.1 Yield (bu./a.)39.843.3 46.6 Production (mil. bu.)3,0343,2893,913 Crush (mil. bu.)1,6891,7301,770 Seed and residual (mil. bu.) 97 -5 114 Exports (mil. bu.)1,3171,6451,700 Ending stocks (mil. bu.) 141 130 475 Farm price per bushel$14.40$13.00$9.00-$11.00
 Yield (bu./a.) Production (mil. bu.)3,0343,2893,913 Crush (mil. bu.)1,6891,7301,770 Seed and residual (mil. bu.) Exports (mil. bu.)1,3171,6451,700 Ending stocks (mil. bu.) Farm price per bushel$14.40$13.00$9.00-$")
22
Source: Unpublished FAPRI-MU projections, Sep. 2014

26
Both ARC and PLC depend on U.S. season- average prices Lower prices increase payments under both programs, all else equal But actual payments under the two programs can differ—sometimes by a lot

27
Price Loss Coverage Payment if annual average farm price is less than reference price ▪ Wheat: $5.50/bu. ▪ Corn: $3.70/bu. ▪ Soybeans: $8.40/bu. ▪ Sorghum: $3.95/bu. ▪ Long-grain rice: $14.00/cwt. Paid on 85% of base acres (tied to historical plantings) Sources: Agricultural Act of 2014, FAPRI-MU March 2014 baseline; USDA baseline, Feb. 2014
 Sources: Agricultural Act of 2014, FAPRI-MU March 2014 baseline; USDA baseline, Feb")
28
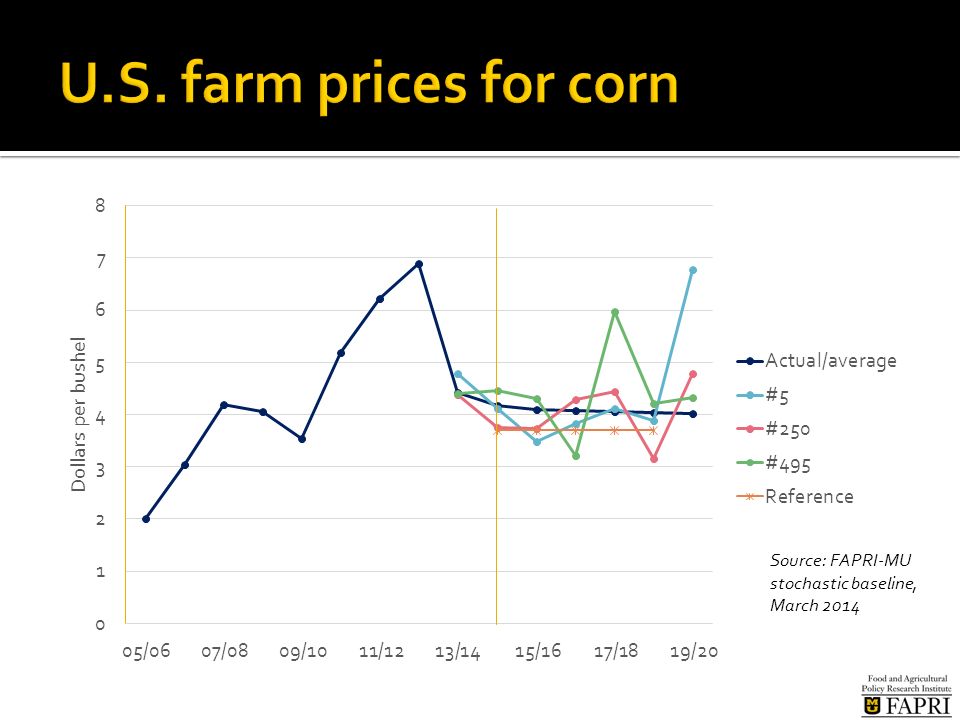
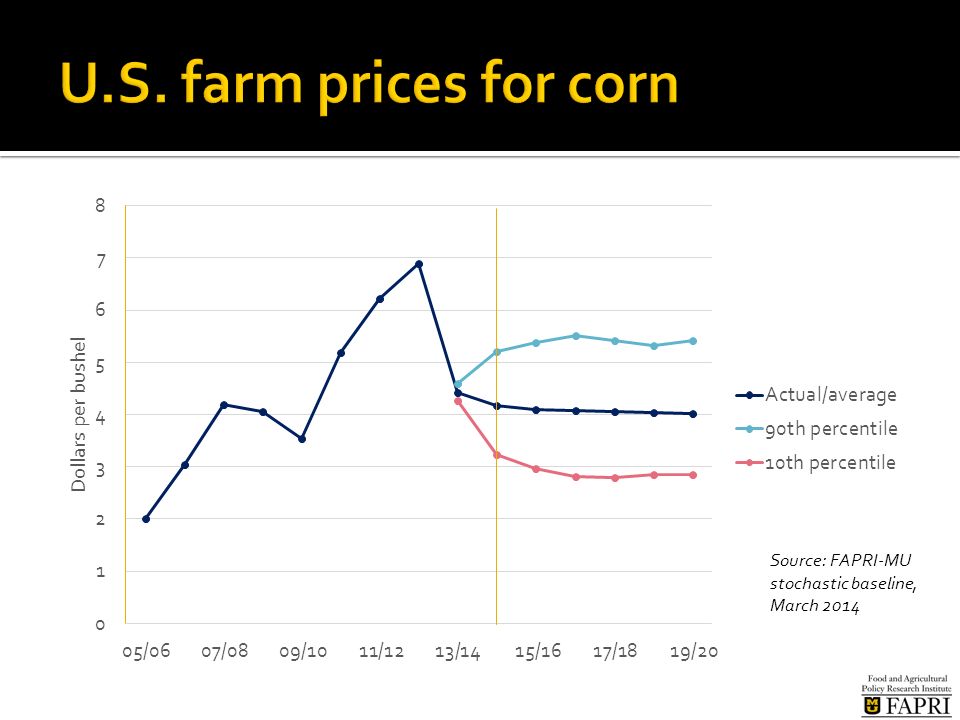
Source: FAPRI-MU stochastic baseline, March 2014

33
Source: FAPRI-MU baselines, March and Sep. 2014; CME December futures contracts, Sep. 23, 2014

34
Source: FAPRI-MU March 2014 stochastic baseline

35
Price Loss Coverage Payment if annual average farm price is less than reference price ▪ Wheat: $5.50/bu. ▪ Corn: $3.70/bu. ▪ Soybeans: $8.40/bu. ▪ Sorghum: $3.95/bu. ▪ Long-grain rice: $14.00/cwt. Paid on 85% of base acres (tied to historical plantings) Sources: Agricultural Act of 2014, FAPRI-MU March 2014 baseline; USDA baseline, Feb. 2014
 Sources: Agricultural Act of 2014, FAPRI-MU March 2014 baseline; USDA baseline, Feb")
36
Source: FAPRI-MU stochastic baseline, March 2014

37
Source: FAPRI-MU baselines, March and Sep. 2014; CME Nov. futures contracts, Sep. 23, 2014

38
Source: FAPRI-MU March 2014 stochastic baseline

39
Price Loss Coverage Payment if annual average farm price is less than reference price ▪ Wheat: $5.50/bu. ▪ Corn: $3.70/bu. ▪ Soybeans: $8.40/bu. ▪ Sorghum: $3.95/bu. ▪ Long-grain rice: $14.00/cwt. Paid on 85% of base acres (tied to historical plantings) Sources: Agricultural Act of 2014, FAPRI-MU March 2014 baseline; USDA baseline, Feb. 2014
 Sources: Agricultural Act of 2014, FAPRI-MU March 2014 baseline; USDA baseline, Feb")
40
Source: FAPRI-MU stochastic baseline, March 2014

41
Source: FAPRI-MU baselines, March and Sep. 2014; CME July futures contracts, Sep. 23, 2014

42
Source: FAPRI-MU March 2014 stochastic baseline

43
Price Loss Coverage Payment if annual average farm price is less than reference price ▪ Wheat: $5.50/bu. ▪ Corn: $3.70/bu. ▪ Soybeans: $8.40/bu. ▪ Sorghum: $3.95/bu. ▪ Long-grain rice: $14.00/cwt. Paid on 85% of base acres (tied to historical plantings) Sources: Agricultural Act of 2014, FAPRI-MU March 2014 baseline; USDA baseline, Feb. 2014
 Sources: Agricultural Act of 2014, FAPRI-MU March 2014 baseline; USDA baseline, Feb")
44
Source: FAPRI-MU baselines, March and September 2014; November 2014 rough rice futures contract, Sep. 24, 2014

45
Source: FAPRI-MU baselines, March and September 2014; CME Dec. futures, Sep. 24, 2014

46
Agriculture Risk Coverage (ARC) Payment if per-acre revenues fall below trigger For this example, using national yields, but actual program uses county- or farm-level yields Paid on share of base acreage ▪ 85% if choose county option ▪ 65% if choose farm option (all crops on farm) Sources: Agricultural Act of 2014, FAPRI-MU Sep. 2014 baseline

47
Max of (national avg. farm price, reference price) County yieldRevenue 2009/10$3.70/bu.146.0 bu./a. 2010/11$5.18122.3 2011/12$6.22105.2 2012/13$6.89 33.4* 2013/14$4.45124.3 Olympic average$5.28117.3 2014/15 benchmark revenue$620 86% of benchmark$533 1 st option triggering payments$3.90<137<$533 2 nd option triggering payments<$3.55150<$533 *Note: this yield would be replaced by a plug yield, but regardless, it is dropped as the lowest of the five years.

48
Source: FAPRI-MU March 2014 stochastic baseline

50
Given Sep. baseline prices, 2014 expected payments would be considerably higher under both programs.

51
Agriculture Risk Coverage (ARC) Payment if per-acre revenues fall below trigger For this example, using national yields, but actual program uses county- or farm-level yields Paid on share of base acreage ▪ 85% if choose county option ▪ 65% if choose farm option (all crops on farm) Sources: Agricultural Act of 2014, FAPRI-MU Sep. 2014 baseline

52
Source: FAPRI-MU March 2014 stochastic baseline

53
Agriculture Risk Coverage (ARC) Payment if per-acre revenues fall below trigger For this example, using national yields, but actual program uses county- or farm-level yields Paid on share of base acreage ▪ 85% if choose county option ▪ 65% if choose farm option (all crops on farm) Sources: Agricultural Act of 2014, FAPRI-MU Sep. 2014 baseline

54
Source: FAPRI-MU March 2014 stochastic baseline

55
Given Sep. baseline prices, 2014 expected payments would be lower under PLC.

56
Source: FAPRI-MU March 2014 stochastic baseline

57
2014/15 national season- average corn price PLC payment per base acre (program yield= 100 bu./a.) ARC payment per base acre if county yield is 110 bu./a. ARC payment per base acre if county yield is 130 bu./a. ARC payment per base acre if county yield is 150 bu./a. 3.00$59.50$52.66 3.20$42.50$52.66 $44.90 3.40$25.50$52.66 $19.40 3.60 $8.50$52.66 $0.00 3.80 $0.00$52.66$33.00 $0.00 4.00 $0.00$52.66$10.90 $0.00 4.20 $0.00$52.66 $0.00 4.40 $0.00 $41.50 $0.00 4.60 $0.00 $22.80 $0.00

58
Source: “U.S. Baseline Briefing Book,” March 2014, page 49

59
FAPRI-MU website: www.fapri.missouri.edu www.fapri.missouri.edu To contact Pat Westhoff: 573-882-4647 westhoffp@missouri.edu westhoffp@missouri.edu FAPRI-MU team: Julian Binfield Sera Chiuchiarelli Deepayan Debnath Scott Gerlt Lauren Jackson Willi Meyers Wyatt Thompson Jarrett Whistance Peter Zimmel

Similar presentations


www.fapri-mu.org Session on “Policy Options.>")
 257-2996>")


 957-5790>")


