Download presentation
Presentation is loading. Please wait.

1
Anne Schlegel VA DEQ November 16, 2015

2
Two Discussion Topics Presentations at the recent SAP meeting Glance at a couple of the “take homes” from 2 of the presentations (Claire Buchanan and Clifton Bell) Feedback, suggested improvements or different approach? Documents and presentations sent or posted on-line Survey “Decision Tree” Survey questions

3
“Comments on September 2015 Empirical Relations Report” Clifton Bell and Will Hunley “Effects-based methods pursued by SAP represent a major improvement in defensibility over past efforts to derive CHLa targets.” “Combined probability approach represents significant advancement over past efforts” “Incorporates a great deal of new James-specific data and experimental results” “Also uses wider literature” “Significant advancement in linkages to harmful algal effects” Cocholodinium Microcystis Microcystin

4
Recommended additions to the Empirical Relations Report “More background on limitations of past efforts” “More background on study drivers, rationale behind approach” “Somewhat more detailed explanation of combined probability methods with example” “Comments on September 2015 Empirical Relations Report” Clifton Bell and Will Hunley

5
Agreement, Recommended Adjustments to CHLa Ranges (From Bell and Hunley) 5
 5")
6
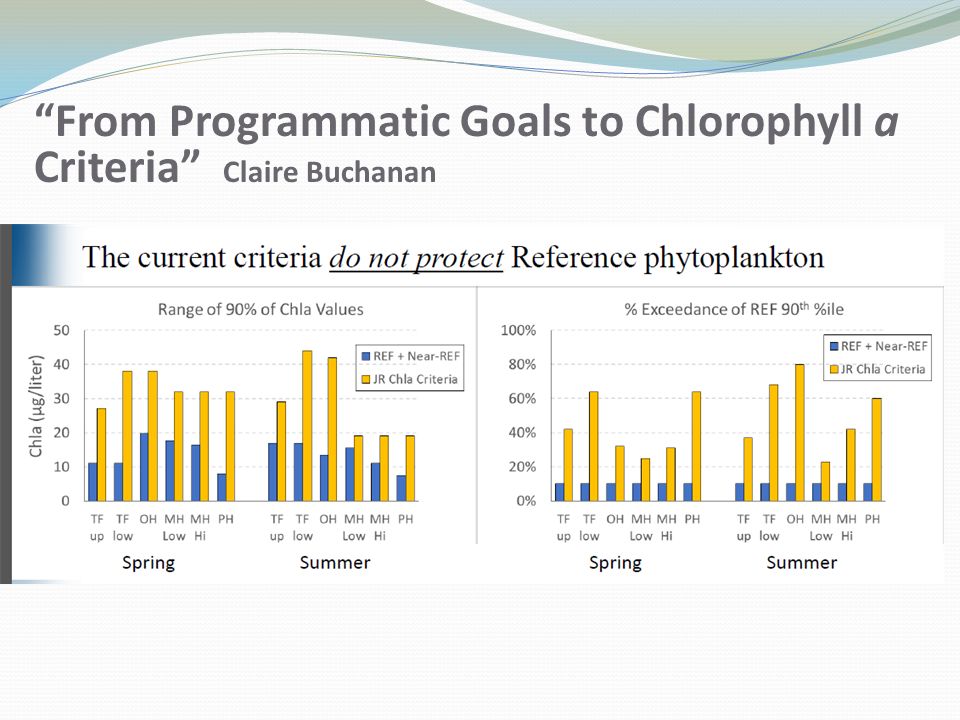
Reference-based approach Combinations of DIN, PO4 and Secchi characterize phytoplankton conditions: reference to degraded “Reference conditions are home to biological communities with “good” integrity” Uses Bay-wide, long-term data to Develop relationships between CHLa means and their upper limits Develop relationship between CHLa mean and % exceedence of a known upper limit or threshold Then used these relationships to…. Determine expected upper limit (e.g. 90 th %ile) of CHLa distribution when seasonal JR criteria are expressed as geometric means Determine % of samples that can be expected to exceed a threshold (e.g. 90 th %ile) for a given CHLa seasonal mean “From Programmatic Goals to Chlorophyll a Criteria” Claire Buchanan
 of CHLa distribution when seasonal JR criteria are expressed as geometric means Determine % of samples that can be expected to exceed a threshold (e.g. 90 th %ile) for a given CHLa seasonal mean From Programmatic Goals to Chlorophyll a Criteria Claire Buchanan.")
8
“We know the central tendencies that protect desirable Ches. Bay phytoplankton….these do not include the current JR criteria…”

9
SAP Survey

10
James River Chlorophyll SAP Survey Purpose: Help to ensure that DEQ understands each SAP member’s opinion about the protectiveness of the current JR chlorophyll criteria “Instructions” to SAP members Consider all project work to inform their opinions Review “Decision Tree” – provides framework for considering the different parts of the standard Survey results will be included with other project products (e.g. reports, data, STAC review) in DEQ’s internal analysis
 in DEQ’s internal analysis.")
11
Criteria Protectiveness “Decision Tree” Are the current criteria, as they appear in the WQS, protective of the aquatic life designated use? Is the magnitude protective? Is the duration protective? Is the frequency protective? Yes to everything Are the criteria over- protective? Yes What needs to be changed? No Keep the criteria the same

12
Criteria Protectiveness Decision Tree Magnitude? Duration? Frequency? What needs to be changed?

13
Criteria Protectiveness Decision Tree Should we be using a different statistic? Instead of a mean, should we be using a median? Do we care more about protecting central tendency or preventing higher-end extremes? If we decide to stick with the current statistic, do the values need to be lowered or raised? Should magnitude be dependent on observed salinity rather than Bay segmentation scheme? Magnitude? Duration? Frequency? What needs to be changed?

14
Criteria Protectiveness Decision Tree Should we be assessing individual observations instead of temporally- aggregated data? Would a monthly or annual mean be superior to a seasonal mean? Magnitude? Duration? Frequency? What needs to be changed?

15
Criteria Protectiveness Decision Tree Should we change how we interpolate the data? Should the spatial dimension be areal or volumetric? Should we be using a different reference curve or exceedence percentage rule? Should the assessment window be lengthened or shortened (6 years or 2 years instead of 3 years)? Magnitude? Duration? Frequency? What needs to be changed?
. Magnitude. Duration. Frequency. What needs to be changed .")
16
James River Chlorophyll SAP Survey Are the current chlorophyll criteria under- OR over- protective in any season-segment with respect to magnitude and duration? Current statistic (geomean) Criteria value Criteria duration Other Provide reasoning for opinions and suggest alternatives if appropriate Are the current criteria over- OR under-protective in any season-segment with respect to frequency? Method for determining frequency of exceedence Three year assessment window DEQ’s current monitoring program Other Provide reasoning for opinions and suggest alternatives if appropriate
 Criteria value Criteria duration Other Provide reasoning for opinions and suggest alternatives if appropriate Are the current criteria over- OR under-protective in any season-segment with respect to frequency. Method for determining frequency of exceedence Three year assessment window DEQ’s current monitoring program Other Provide reasoning for opinions and suggest alternatives if appropriate.")
17
James River Chlorophyll SAP Survey Is the proposed assessment methodology over- OR under- protective of the James River aquatic life designated use? Method for determining frequency of exceedence Six year assessment window Other Provide reasoning and suggest alternatives if appropriate Any other recommendations to make to DEQ?

18
So what is DEQ doing with all of this information? The feedback provided and the survey results will be included along with all other project products (e.g. reports, data, STAC review) in DEQ’s internal analysis
 in DEQ’s internal analysis.")
Similar presentations


: 1.>")


 Ann Ooms (Kingston College, UK) Joan Garfield (Univ. of Minnesota, USA) Beth Chance (Cal Poly State Univ., USA)>")


