Download presentation
Presentation is loading. Please wait.

1
Hybrid measurement of CR light component spectrum by using ARGO-YBJ and WFCTA Shoushan Zhang on behalf of LHAASO collaboration and ARGO-YBJ collaboration IHEP (Institute of High Energy Physics), Beijing, China 32th ICRC, August 11-18, 2011, Beijing, China.
, Beijing, China 32th ICRC, August 11-18, 2011, Beijing, China.")
2
Outline Motivation WFCTA and ARGO experiment introduction Data analysis Preliminary result Summary and discussion

3
Hybrid measurement Lateral distributionproton iron Density ratio: the ratio of particle density at two different shower core distance Aim: To build an overlap between balloon measurements and ground based experiment for cross- calibration of the experiments. Motivation -- ARGO-YBJ: lateral distribution Density ratio mass sensitive -- Cherenkov Telescope: longitudinal information Hillas parameter mass sensitive Better energy resolution

4
1. 5m 2 spherical mirror ; 2. Camera: 16x16 PMT array 3. Pixel size 1 º, 4. FOV: 14 º x16º. 5. Elevation angle: 60º Wide Field of View Cerenkov Telescope (WFCT) WFCA @ YBJ Hybrid observation: WFCA && ARGO 50m ARGO-YBJ experiment 2. Detector introduction Start from July 2006 Rate : 3.5kHz Threshold : ~ 300 GeV Duty cycle: >86% FOV: 2 sr ARGO Hall One of Cherenkov event Number of Fired Strips Strips Big pad Strips
 YBJ Hybrid observation: WFCA && ARGO 50m ARGO-YBJ experiment 2. Detector introduction Start from July 2006 Rate : 3.5kHz Threshold : ~ 300 GeV Duty cycle: >86% FOV: 2 sr ARGO Hall One of Cherenkov event Number of Fired Strips Strips Big pad Strips.")
5
Simulation && data selection Calibration Component discrimination Energy reconstruction Data analysis

6
Simulation Cherenkov simulation : Ray tracing package ARGO simulation: G4argo Telescope simulation Shower simulation Tool: Corsika6735 + QGSJETII-03 + GHEISHA Component model: J.R. Horandel (2003) Primary particles: proton, helium, CNO, MgAlSi, iron Energy range: 10 TeV – 1PeV Geometry: the: 20 – 42, phi: 69-111, Core: +/- 130 m Geometry reconstruction: From ARGO-YBJ Core resolution: 1000 Angular resolution: 1000 J.R. Horandel (2003)
 Primary particles: proton, helium, CNO, MgAlSi, iron Energy range: 10 TeV – 1PeV Geometry: the: 20 – 42, phi: , Core: +/- 130 m Geometry reconstruction: From ARGO-YBJ Core resolution: 1000 Angular resolution: 1000 J.R. Horandel (2003).")
7
Data selection Cherenkov image cleaning: Signal to noise ratio>3.5; Arrival time information: all triggered pixel should be within a time window Δt=240 ns; Rejection isolated pixel. Data selection: The stereo data from 2008.12 ~ 2009.03: 314,928 Good weather selection: 213,839 events left (LL. Ma etc. ICRC 2011, poster 1033) Geometry selection: 20526 -- core position locates in ARGO center carpet: x(-40, 40) m, y (-40, 40) m; -- the 26-34, phi 39 – 55 for full Cherenkov image.
 Geometry selection: core position locates in ARGO center carpet: x(-40, 40) m, y (-40, 40) m; -- the 26-34, phi 39 – 55 for full Cherenkov image..")
8
Simulation and data comparison Log10(total Npe) ρ(20)/ρ(40) Cherenkov sizeDensity ratio ARGO-YBJ hit numbers Impact parameter
 ρ(20)/ρ(40) Cherenkov sizeDensity ratio ARGO-YBJ hit numbers Impact parameter")
9
Cherenkov Telescope Calibration Method 1: A calibrated LED is mounted on the center of the mirror to calibrate Cherenkov telescope every day. The transmission of the glass window and reflectivity of the mirrors are not take into. Method 2: End to end calibration: N2 Laser device, but unfinished. (Yong Zhang etc. ICRC2011, oral 1344) S.S. Zhang et al., NIM A (2011) The systematic uncertainty of the calibration constant : ~ 7%. Gain monitor result
 S.S. Zhang et al., NIM A (2011) The systematic uncertainty of the calibration constant : ~ 7%. Gain monitor result.")
10
20-200TeVProtonheliumCNOMgAlSiIron Primary41.0%26.6%13.5%8.2%9.4% After cut65.5%29.0%4.4%1.0%0.1% The contamination of heavy component is about 5.5% Strips Big pad will be used Energy distribution of primary and after cut Component discrimination: ARGO density ratio cut

11
Impact parameter (Rp): 5m/bin Log(total Npe) bin: 0.1/bin Energy reconstruction: look- up table Energy resolution : ~23% Bias: < 5%
: 5m/bin Log(total Npe) bin: 0.1/bin Energy reconstruction: look- up table Energy resolution : ~23% Bias: < 5%")
12
WFCTA-ARGO data agree with CREAM and ARGO-YBJ results Direct and ground-based measurements have overlap making possible the cross-calibration of the experiments. Next steps: Using ARGO-YBJ big pad data and WFCTA to measure higher energy up to PeV. Hillas parameters to discriminate component The contamination of heavy component is about 5.5% Preliminary result

13
Summary and Discussion Uncertainty Calibration: 10% in flux Atmosphere condition: 12% in flux Reconstruction: <5% Mirror reflection: Unfinished Primary component model: unfinished Simulation tool: unfinished Hadronic model: The results of Large Hadron Collider forward (LHCf) experiment show that none of the hadronic interaction models agree perfectly with the measurements, but QGSJET II-03 show good agreement than the other models (O. Adriani et al., arXiv:1104.5294 Energy resolution: ~23% and bias <5% Preliminary light component energy spectrum: 30TeV – 200 TeV, with contamination of heavy component less than 5.5%. Next step -- Big pad data for higher energy up to PeV; -- Cherenkov image information such as hillas parameters to discriminate component; -- Uncertainties study: calibration, simulation tool and primary component model.

17
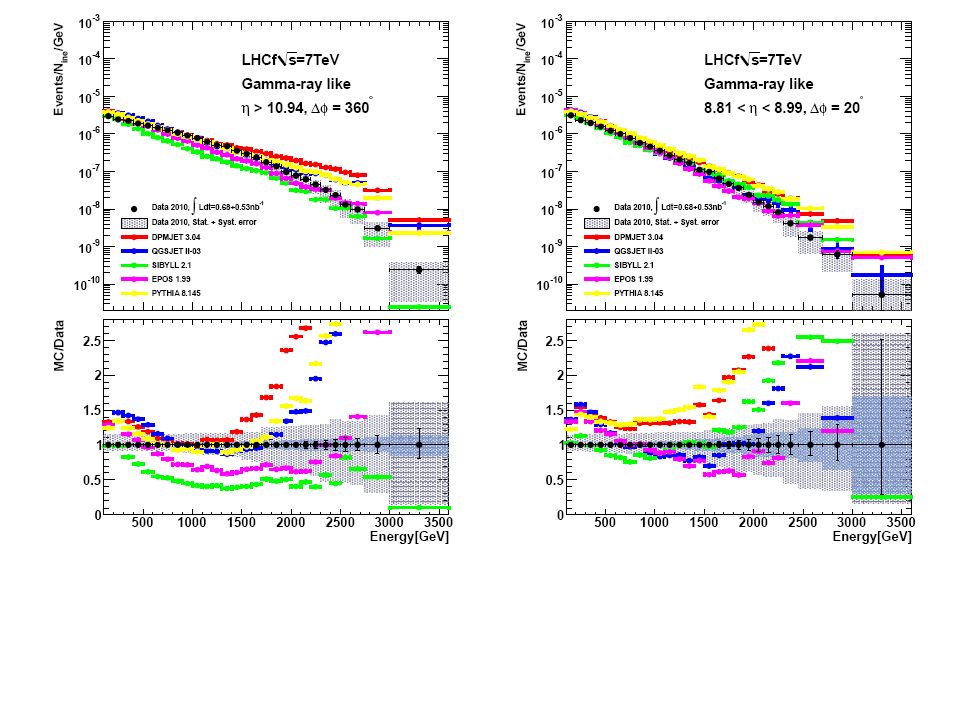
1) For η>10.94, QGSJET II-03, DPMJET 3.04 and PYTHIA 8.145 show very good agreement with the experimental result between 0.5 and 1.5TeV, but they predict significantly larger photon yield at high energy >2TeV. 2) For η>10.94, SIBYLL 2.1 shows a very good agreement with the experimental result for the spectral shape for >0.5TeV, but predicts a photon yield only half of the experimental result over the entire energy range. 3) For 8.81<η<8.99, difference in the spectral shape between the experimental data and the models is not as large as the case 1), but still a large deviation at high energy is found for the DPMJET 3.04 and PYTHIA 8.145 models.
 For η>10.94, SIBYLL 2.1 shows a very good agreement with the experimental result for the spectral shape for >0.5TeV, but predicts a photon yield only half of the experimental result over the entire energy range. 3) For 8.81<η<8.99, difference in the spectral shape between the experimental data and the models is not as large as the case 1), but still a large deviation at high energy is found for the DPMJET 3.04 and PYTHIA models..")
Similar presentations


 School of Physics and Astronomy, University of Leeds, UK b) For full.>")


 By: Rasha Usama Abbasi.>")


 Collaboration GZK-40. INR, Moscow. May 17, 2006. measurements by fluorescence.>")

