Download presentation
Presentation is loading. Please wait.

1
I NFERENCE F OR R EGRESSION Is a child’s IQ linked to their crying as an infant?

2
Crying and IQ Infants who cry easily may be more easily stimulated than others and this may be a sign of higher IQ. Child development researchers explored the relationship between the crying of infants four to ten days old and their later IQ scores. A snap of a rubber band on the sole of the foot caused the infants to cry. The researchers recorded the crying and measured intensity by the number of peaks in the most active 20 seconds. They later measured the children’s IQ at age three years using the Stanford-Binet IQ test. The data for this experiment is on the next page (Table 14.1 in our book).
..")
3
Crying and IQ CryingIQCryingIQCryingIQCryingIQ 1087209017941294 1297161001910312103 9 231031310414106 16106271081810910109 18109151121811223113 1511421114161189119 12119121201912016124 20132151332213531135 16136171413015522157 3315913162

4
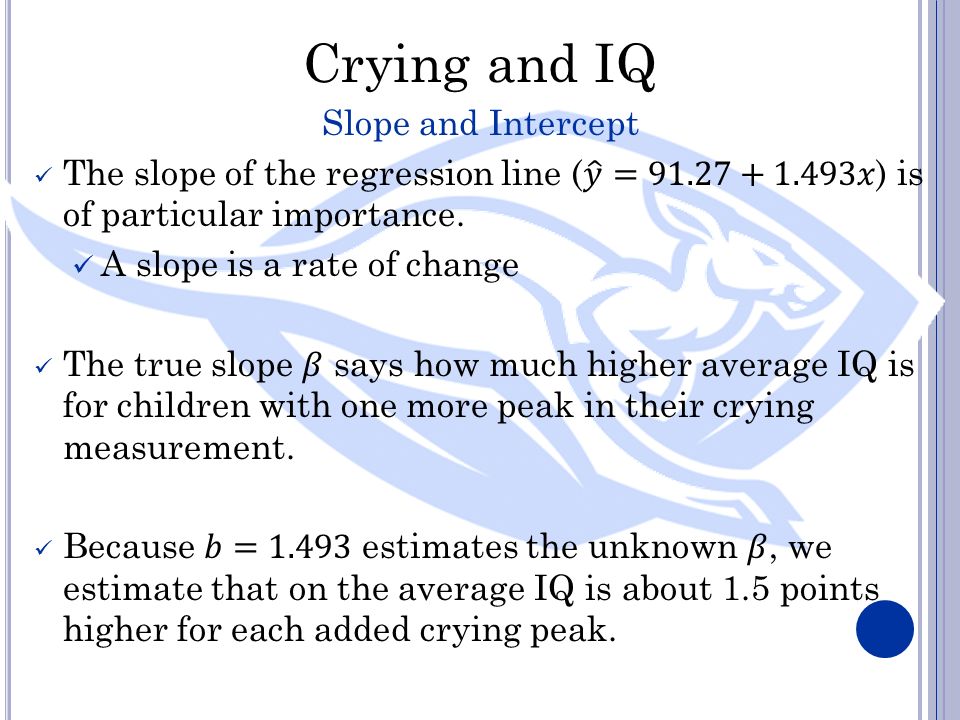
Crying and IQ Plot and Interpret Input the data in your calculator and create a scatterplot Look for form, direction and strength in the plot Numerical Summary Calculate a LinReg(a+bx) L 1, L 2, y Make note of the value of r Mathematical Model We are interested in predicting the response (IQ) from the explanatory (crying) Create an LSRL using a and b
 L 1, L 2, y Make note of the value of r Mathematical Model We are interested in predicting the response (IQ) from the explanatory (crying) Create an LSRL using a and b")
9
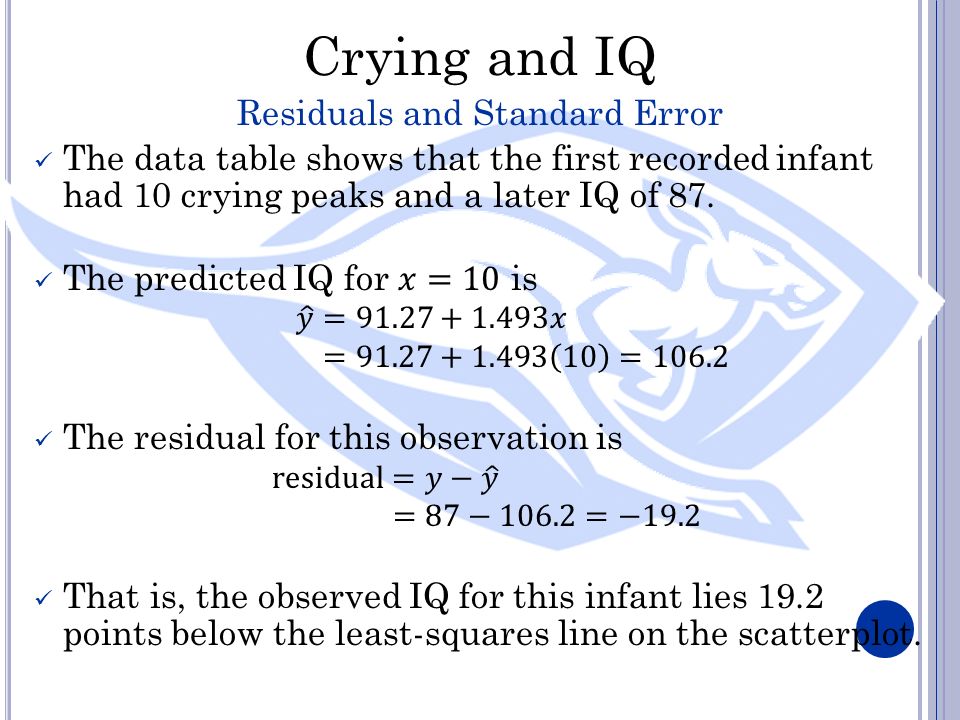
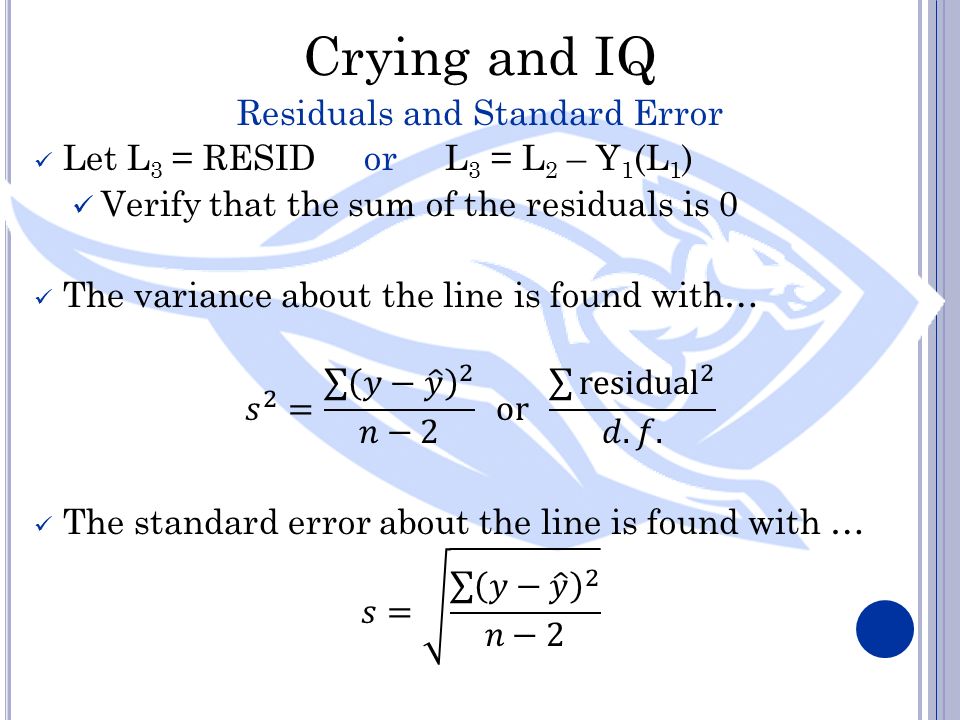
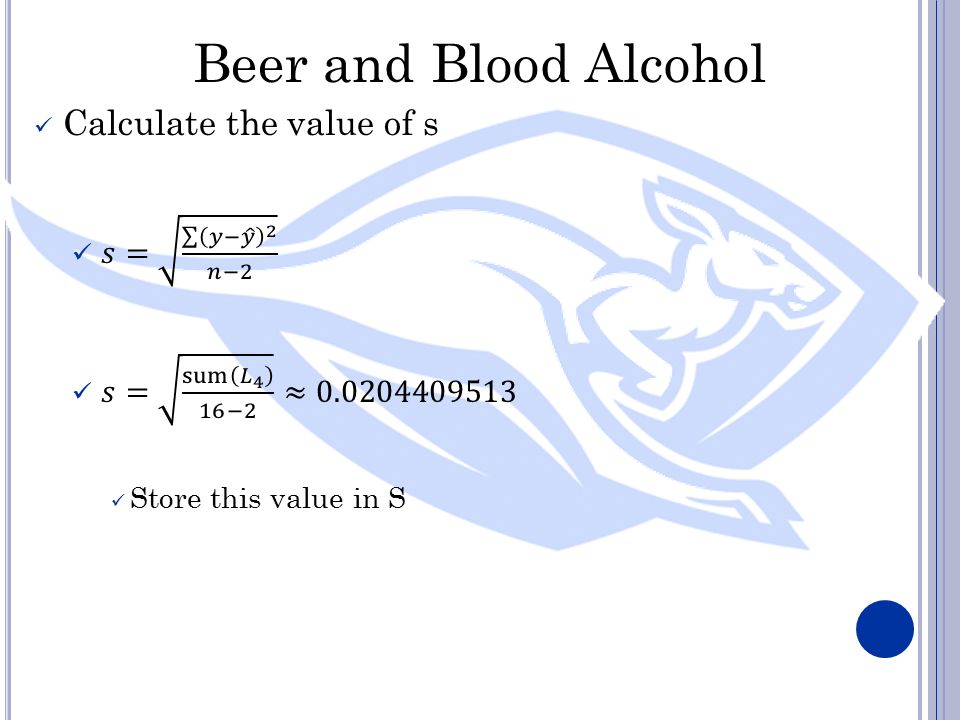
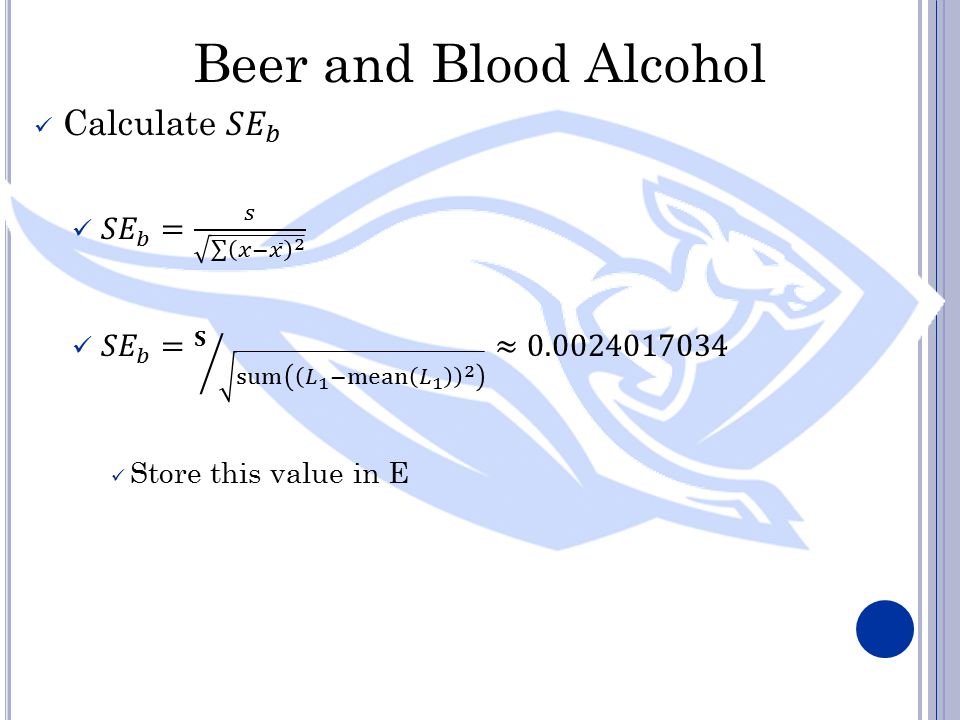
Crying and IQ Residuals and Standard Error I would suggest letting L 4 = L 3 2 What is the variance of our data? What is the standard error of our data?

11
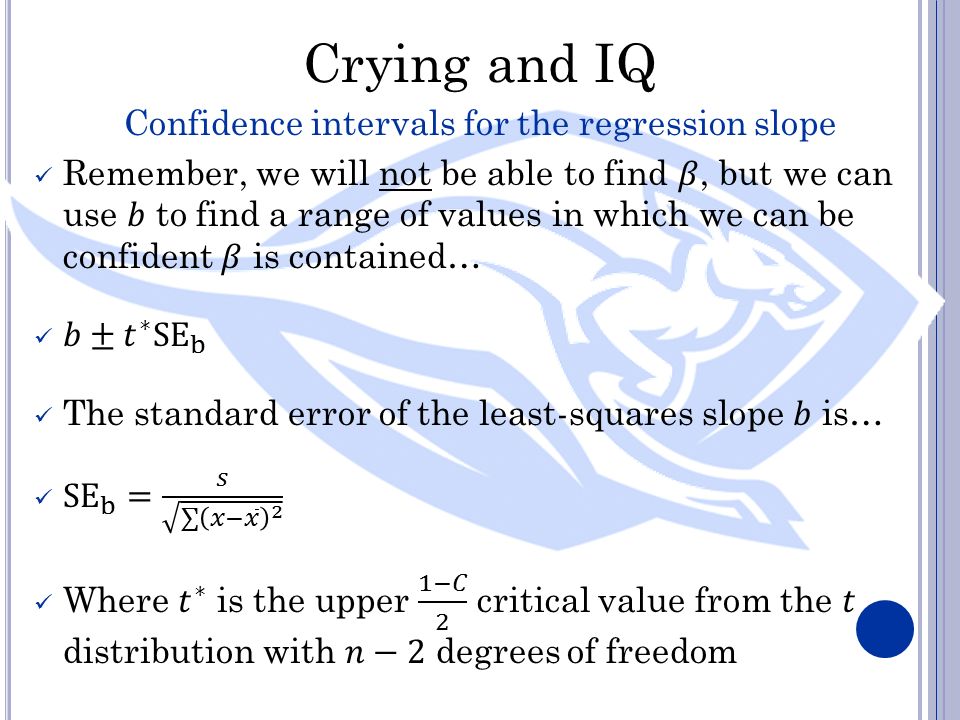
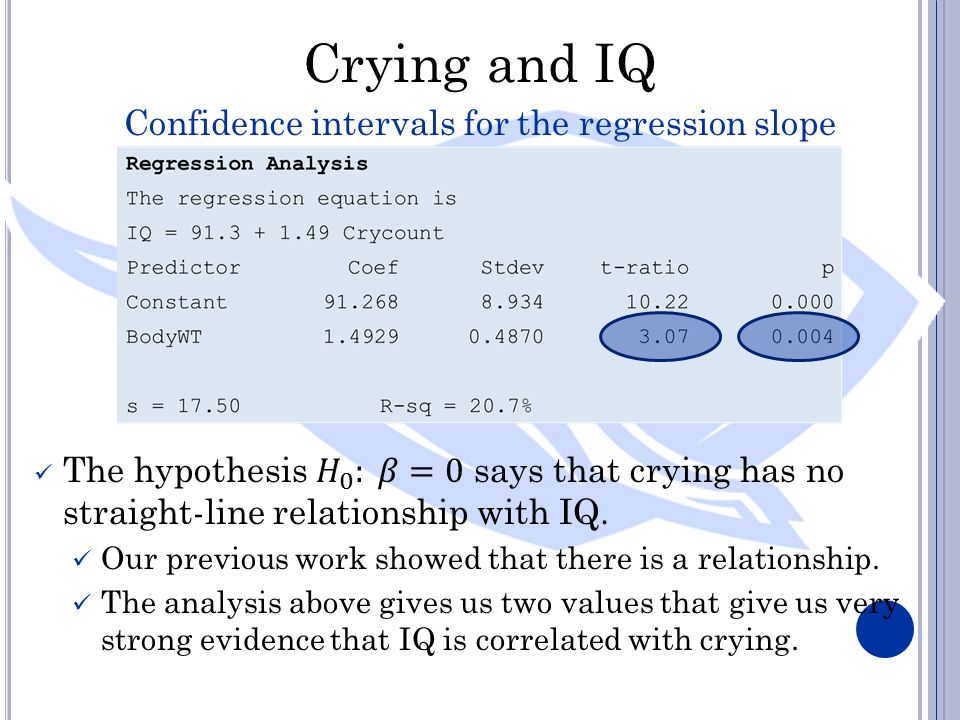
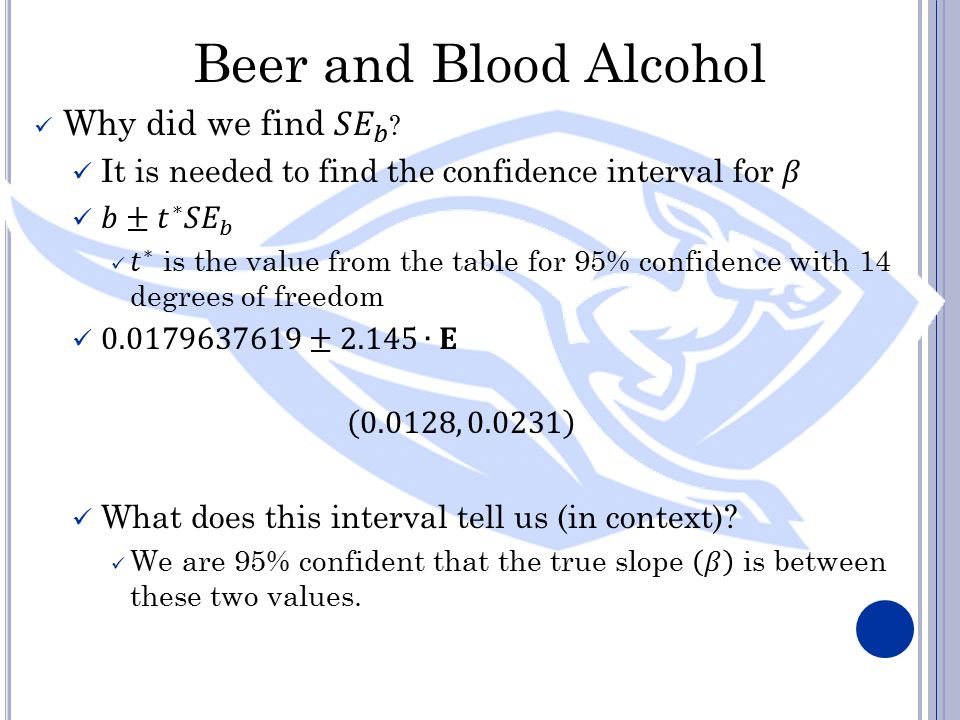
Crying and IQ Confidence intervals for the regression slope The output below for the crying study is from the regression command in the Minitab software package. Most such packages have similar output. The first line gives the equation of the lest-squares regression line.

12
Crying and IQ Confidence intervals for the regression slope Let’s look at the rest of the information given.

14
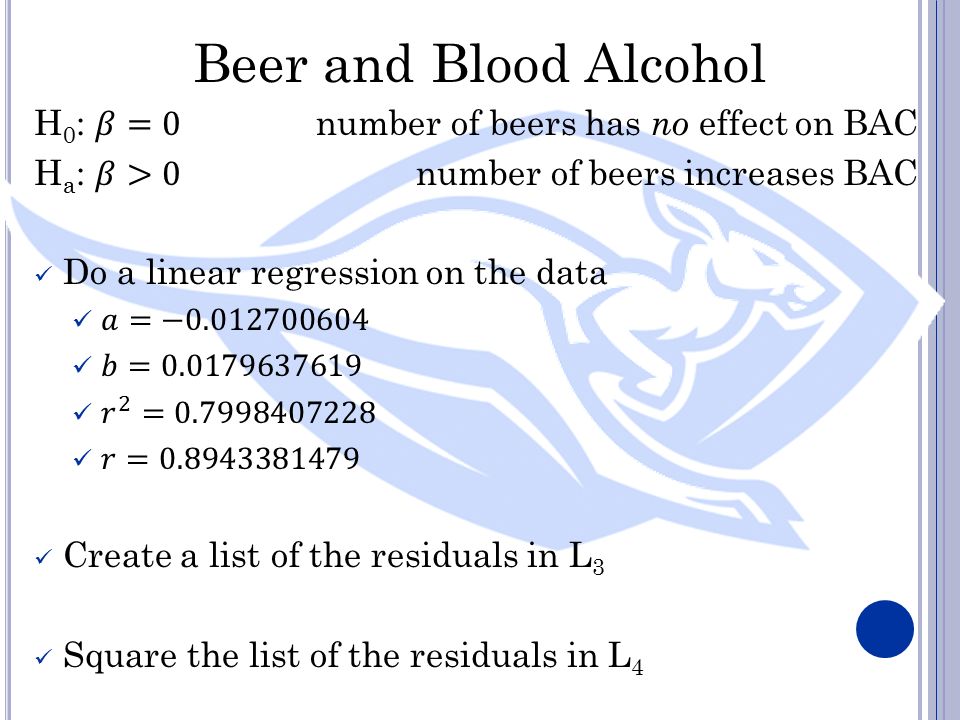
Beer and Blood Alcohol How well does the number of beers a student drinks predict his or her blood alcohol content? Sixteen student volunteers at Ohio State university drank a randomly assigned number of cans of beer. Thirty minutes later, a police officer measured their blood alcohol content (BAC). Here are the data: Student:12345678 Beers:52983735 BAC:0.100.030.190.120.040.0950.070.06 Student:910111213141516 Beers:35465714 BAC:0.020.050.070.100.0850.090.010.05
. Here are the data: Student: Beers: BAC: Student: Beers: BAC:")
15
Beer and Blood Alcohol The students were equally divided between men and women and differed in weight and usual drinking habits. Because of this variation, many students don’t believe that number of drinks predicts blood alcohol well. What do the data say? Student:12345678 Beers:52983735 BAC:0.100.030.190.120.040.0950.070.06 Student:910111213141516 Beers:35465714 BAC:0.020.050.070.100.0850.090.010.05

16
Beer and Blood Alcohol Let’s input the data into our calculators Beers will be our explanatory variable BAC will be our response variable Student:12345678 Beers:52983735 BAC:0.100.030.190.120.040.0950.070.06 Student:910111213141516 Beers:35465714 BAC:0.020.050.070.100.0850.090.010.05

25
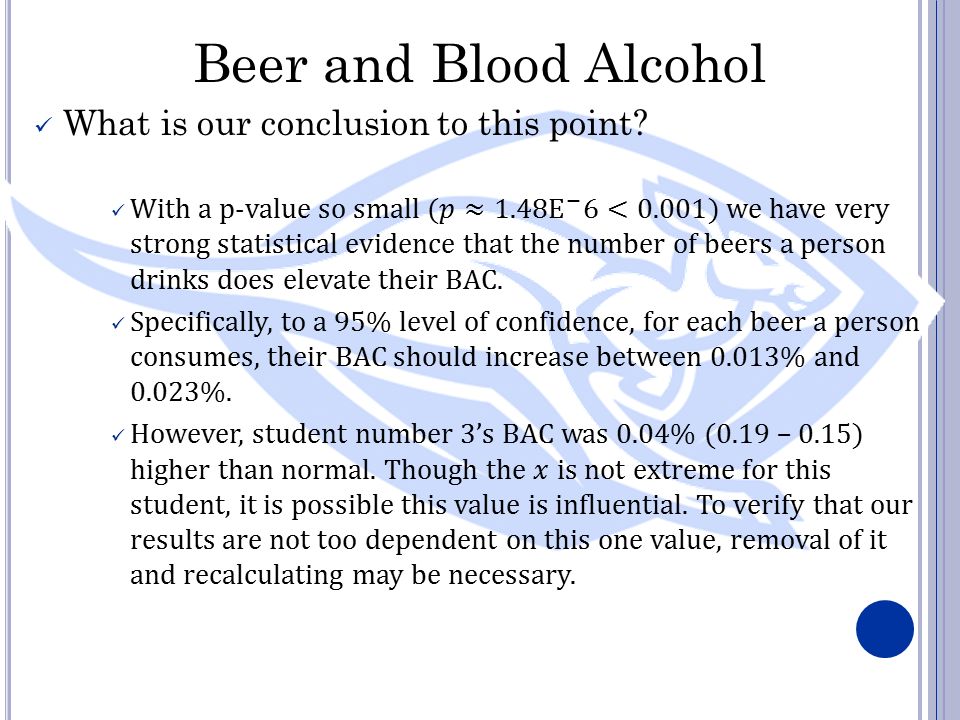
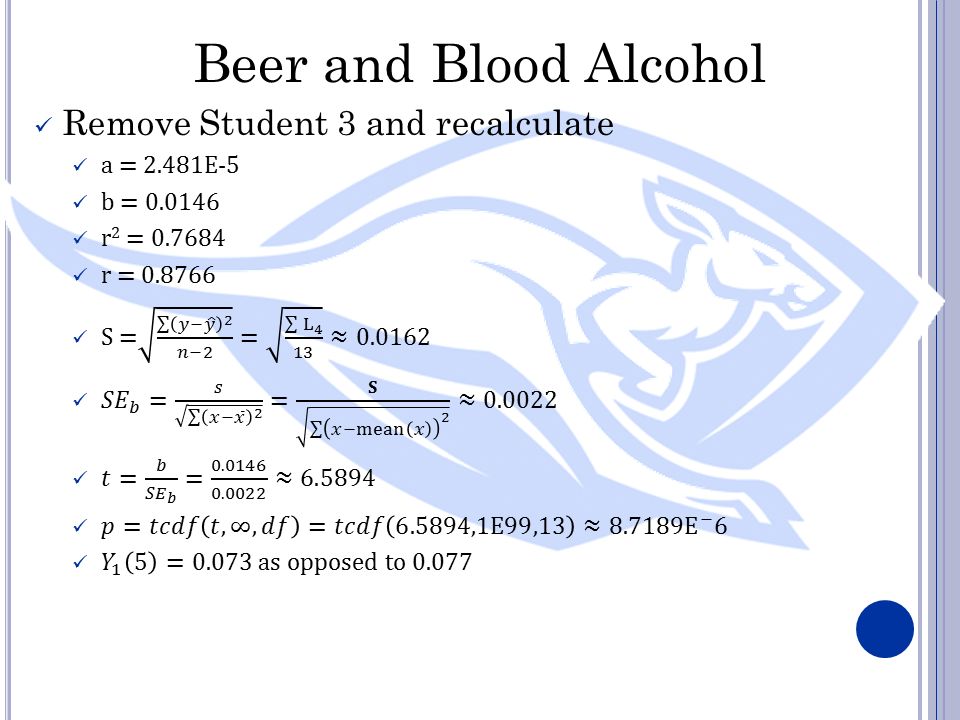
Predicting Blood Alcohol Steve thinks he can drive legally 30 minutes after he finishes drinking 5 beers. We want to predict

Similar presentations


>")


 regression.>")


