Download presentation
Presentation is loading. Please wait.

1
Energy Flows and feedback processes: A systems perspective

2
Example of a system diagram related to atmospheric water

3
What do you know? Have you ever learned how to create and use systems diagrams (causal loop diagrams)? ____Yes ___No If yes, how would you rate your understanding of creating and using them? Very poor 1 2 3 4 5 Expert
. ____Yes ___No If yes, how would you rate your understanding of creating and using them. Very poor Expert.")
4
System Diagrams Our goal today is to learn how to create and analyze systems diagrams, with emphasis on Earth’s climate system as well as their generic applicability.

5
Earth’s Energy Balance is used here to develop and explain causal loop diagrams. Review slide

6
Connections (+ or - ??)** put a + or – near the tip of the arrow to indicate whether the connection between the two climate system variables is positive or negative. Absorbed Sunlight Earth’s Mean Temperature Planetary albedo Earth’s Mean Temperature Emitted Infrared Earth’s Mean Temperature Water Vapor Earth’s Mean Temperature CO 2 Earth’s Mean Temperature Cloud cover Earth’s Mean Temperature System variables should be nouns (Earth’s Temperature rather than warming.) ** A connection is positive if when the first increases the second also increases, and a connection is negative (opposite) if when the first increases the second decreases.
 ** A connection is positive if when the first increases the second also increases, and a connection is negative (opposite) if when the first increases the second decreases..")
7
Connections (+ or - ??)* put a + or – near the tip of the arrow to indicate whether the connection between the two climate system variables is positive or negative. Absorbed Sunlight + Earth’s Mean Temperature Planetary albedo - Earth’s Mean Temperature Emitted Infrared - Earth’s Mean Temperature Water Vapor + Earth’s Mean Temperature CO 2 + Earth’s Mean Temperature Cloud cover + or - Earth’s Mean Temperature use nouns * A connection is positive if when the first increases the second also increases, and a connection is negative (opposite) if when the first increases the second decreases.
 if when the first increases the second decreases..")
8
A system diagram What are the missing connections? + or -

9
A system diagram: identifying feedback structure See Appendix 1 for further discussion of water vapor feedback.

10
A Challenge Draw a systems diagram to describe the following: The sun becomes brighter causing Earth to warm. As the Earth warms it gives off more longwave radiation until it settles into a new equilibrium temperature. Your diagram should have the sun’s brightness as an external driver to Earth’s temperature and Earth’s Temperature connected with emitted longwave (infrared*) radiation. * Infrared radiation emitted from Earth or its atmosphere is also referred to as longwave or terrestrial radiation.
 radiation. * Infrared radiation emitted from Earth or its atmosphere is also referred to as longwave or terrestrial radiation..")
11
A first Challenge: diagram structure Draw a systems diagram to describe the following: The sun becomes brighter causing Earth to warm to a new equilibrium temperature. sunlight Earth’s mean Temperature Emitted infrared energy ? ? ? Notice that the sun is not within the feedback loop structure. ? What are the missing connections? + or -

12
A first Challenge: completed diagram Draw a systems diagram to describe the following: The sun becomes brighter causing Earth to warm to a new equilibrium temperature. sunlight Earth’s mean Temperature Emitted infrared energy + - - + Notice that the sun is not within the feedback loop structure. This negative feedback loop is always present in the Earth System and helps limit (or balances) the runaway effects of positive feedback processes.
 the runaway effects of positive feedback processes..")
13
Ice albedo feedback process As Earth’s temperature increases from increased solar radiation output there will be less snow and ice cover globally. This decreases the planetary albedo causing even more sunlight to be absorbed by the climate system resulting in amplified warming. Again solar output (or intensity) is an external driver and will not be within the loop structure. A systems diagram capturing the essence of the feedback process is shown on the next slide.
 is an external driver and will not be within the loop structure. A systems diagram capturing the essence of the feedback process is shown on the next slide..")
14
Ice albedo feedback. Diagram Structure What is the polarity (sign) of each connection? 1. 2. 3. 4. 5.

15
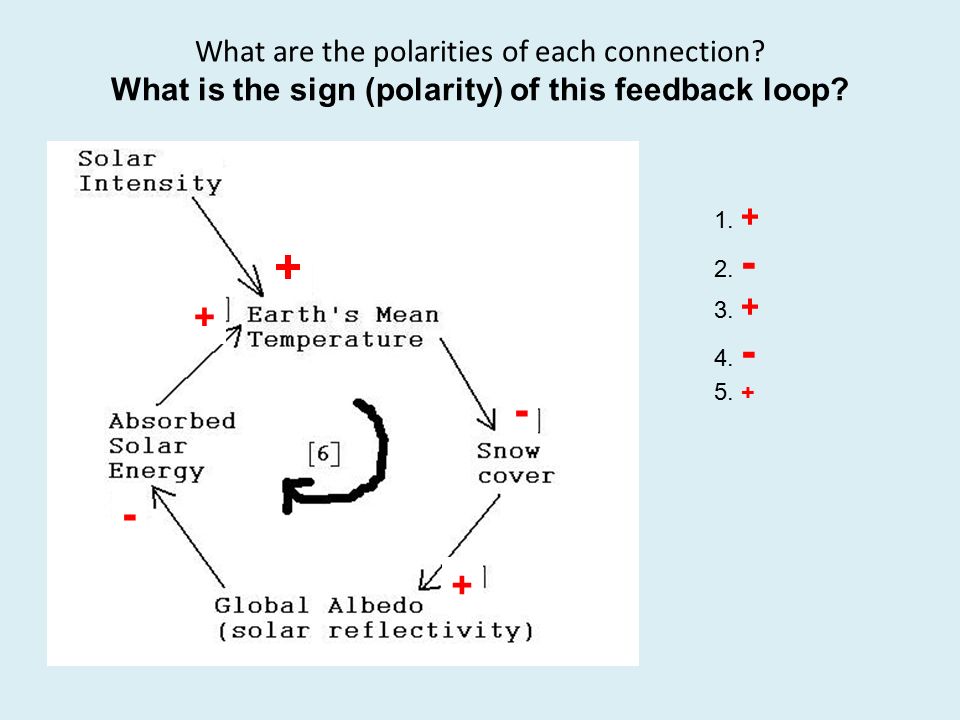
What are the polarities of each connection? What is the sign (polarity) of this feedback loop? 1. + 2. - 3. + 4. - 5. + + + + - -
16
Is this a Positive or Negative feedback loop? 1. + 2. - 3. + 4. - 5. + What is the sign of this feedback loop? Positive When the number of negative connections in a causal loop is even then the loop is positive, odd then the loop is negative. + + + + - -

17
It is important to realize that the negative feedback loop between Earth’s temperature and emitted terrestrial radiation is always present. This limits limits/balances the positive feedback.

18
The terms positive and negative feedbacks have no reference to the value (good or bad) of the feedback. They are often referred to as amplifying and balancing feedbacks. Sometimes the results of positive feedbacks are characterized as “spiraling out of control” or the “snow ball effect”.

19
Two new connections Are the connections positive or negative? Earth’s surface temperature ? CO 2 solubility in oceans CO 2 solubility in oceans ? Atmospheric CO 2

20
Two new connections Are the connections positive or negative? Earth’s surface temperature - CO 2 solubility in oceans CO 2 solubility in oceans - Atmospheric CO 2

21
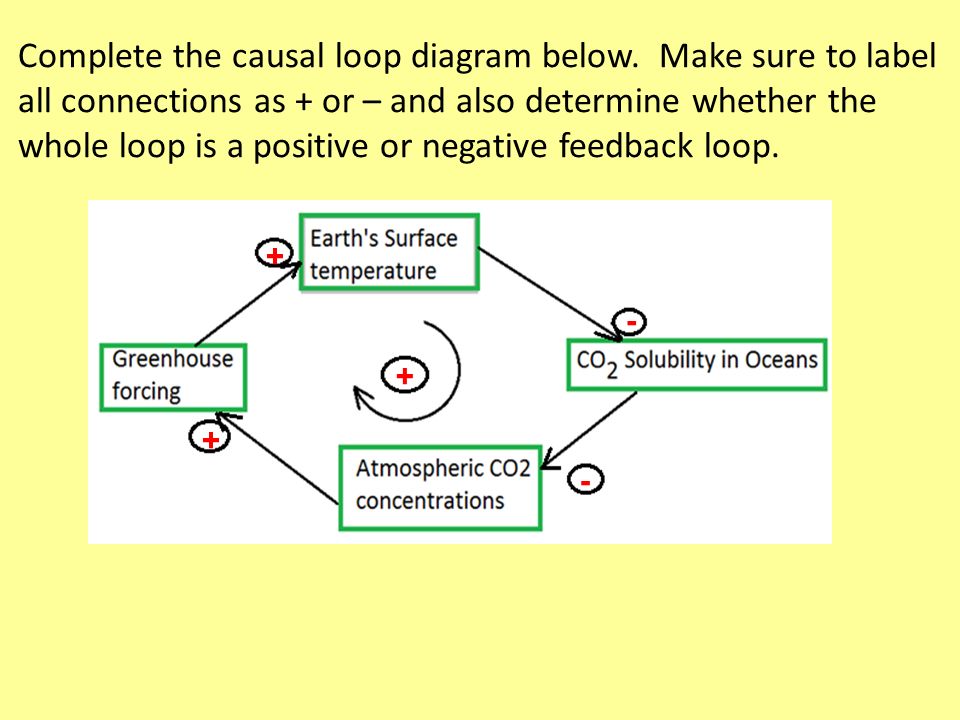
Complete the causal loop diagram below. Make sure to label all connections as + or – and also determine whether the whole loop is a positive or negative feedback loop.

22
+ + - - +
23
Select one of the ideas below as a basis to create a complete yet simple systems diagram. The nouns (key variables to be connected) are listed. In your own words, briefly explain your systems diagram structure. 1.Dieting: emotional health, caloric food intake, person’s weight, exercise. 2.Drug addiction: Self esteem, Risk for drug use, drug use, emotional instability (Can you think of an outside factor that may initiate the original degradation of self esteem). 3.Forest Fires: Forest fires, activity to stop fires, forest fire fuel. 4.Career success: Interest in projects, time spent working on projects, success on projects. 5.Crying wolf: boredom relief, crying wolf, attention gained. 6.Market place: Product Inventory, product price, consumption of product 7.Or one of your own. Possible answers to the above examples are included in Appendix 3
 are listed. In your own words, briefly explain your systems diagram structure. 1.Dieting: emotional health, caloric food intake, person’s weight, exercise. 2.Drug addiction: Self esteem, Risk for drug use, drug use, emotional instability (Can you think of an outside factor that may initiate the original degradation of self esteem). 3.Forest Fires: Forest fires, activity to stop fires, forest fire fuel. 4.Career success: Interest in projects, time spent working on projects, success on projects. 5.Crying wolf: boredom relief, crying wolf, attention gained. 6.Market place: Product Inventory, product price, consumption of product 7.Or one of your own. Possible answers to the above examples are included in Appendix 3.")
24
In your own words describe the feedback loop a b c d e a.

25
Possible Answer: As Earth’s temperature increases, increased evaporation (not shown) increases atmospheric water vapor. This increases the atmospheric emissivity, resulting in more longwave radiation going downward from Earth’s atmosphere to its surface. This results in increased surface heating and subsequently a higher surface temperature than would be expected without this positive feedback process.

26
What is the meaning of loop a b c f g d e a?

27
Possible answer: this captures the idea that as the atmosphere warms it also radiates more energy to the surface. i.e. The downward flux of longwave radiation from the atmosphere to Earth’s surface is proportional to the product of atmospheric emissivity and the fourth power of atmospheric temperature. Loop a b c d e a captures the increase in emissivity Loop a b c f g d e a capture the increase in atmospheric temperature.

28
Appendix 3. Possible systems diagrams for: Select one of the ideas below as a basis to create a complete yet simple systems diagram……. In your own words, briefly explain your causal loop structure. 1.Dieting: emotional health, caloric food intake, person’s weight, exercise. 2.Drug addiction: Self-esteem, Risk for drug use, drug use, emotional instability (Can you think of an outside factor may initiate the original change in self esteem). 3.Forest Fires: Forest fires, activity to stop fires, forest fire fuel. 4.Career success: Interest in career, amount of time spent working, success on projects 5.Crying wolf: boredom relief, crying wolf, attention gained. 6.Market place: Product Inventory, product price, consumption of product 7.Or one of your own.
. 3.Forest Fires: Forest fires, activity to stop fires, forest fire fuel. 4.Career success: Interest in career, amount of time spent working, success on projects 5.Crying wolf: boredom relief, crying wolf, attention gained. 6.Market place: Product Inventory, product price, consumption of product 7.Or one of your own..")
29
Appendix 3.1 Dieting: emotional health, caloric food intake, person’s weight, exercise. Both loops are positive suggesting that either weight gain or loss can be amplified. It is interesting to speculate about modifications to this diagram that may capture key aspects of anorexia or bulimia disorders.

30
Appendix 3.2 Drug addiction: Self esteem, Risk for drug use, drug use, emotional instability (Can you think of an outside factor that may initiate the original degradation of self esteem). Granted this is an over simplistic view of the drug addition cycle. Outside factors could be dis-functional relationships, outside demands for performance, or loss of loved-one or long held job.

31
Appendix 3.3 Forest Fires: Forest fires, activity to stop fires, forest fire fuel. Assumptions: 1)As Forest fires increase in number the tendency to fight fire increases 2)Fighting fires reduces then burning of underbrush and other fuels so fighting fires increases the available forest fire fuel 3)When there is more fuel the chance of a forest fire start from lightning or human activity increases.
As Forest fires increase in number the tendency to fight fire increases 2)Fighting fires reduces then burning of underbrush and other fuels so fighting fires increases the available forest fire fuel 3)When there is more fuel the chance of a forest fire start from lightning or human activity increases..")
32
Appendix 3.4 Career success: Interest in projects, time spent working on projects, success on projects. Assumptions: 1)Interest in projects inspires spending time working on projects 2) time spent working on projects promotes success on projects. 3) success on projects fuels interest in projects.
Interest in projects inspires spending time working on projects 2) time spent working on projects promotes success on projects. 3) success on projects fuels interest in projects..")
33
Appendix 3.5 Crying wolf: boredom relief, crying wolf, attention gained Assumptions: 1)Crying wolf works at gaining attention 2) The attention gained helps relieve boredom 3)success at boredom relief promotes the desire to continue to cry wolf. Karl North describes the full story and the balancing loop that dominates once the “townspeople” lose trust in the boy. He extends this analogy in “Folk Tales, Foreign Policy, and the Value of Systems Thinking”Folk Tales, Foreign Policy, and the Value of Systems Thinking

34
Appendix 3.6 Market place: Product Inventory, product price, consumption of product The connections 1)As product inventory increases, product price decreases 2) As product price increases, consumption of product decreases 3)As consumption of product increases, product inventory decreases. A specific example of this structure related to hogs and pork is given in http://cabiles-cano.wikispaces.com/Case+8+-+Building+%26+Simulating+a+Model+Using+Dynamo

35
Appendix 4 Other examples

36
Chemical weathering T/F All loops in the systems diagram above are negative

37
True/False All loops in the systems diagram above are negative Chemical weathering

Similar presentations


. Atmospheric homeostasis.>")


 1. Tonight – 10/03 Radiation Radiation EM radiation – universe, Sun, Earth EM radiation – universe, Sun, Earth Global.>")

 an event or phenomenon in the past.>")

