Download presentation
Presentation is loading. Please wait.

1
Low lightHigh light High light response in Arabidopsis thaliana 4 days 1100 transcripts change Anthocyanin light response mutant

2
Mutant characterisation by metabolite profiling Targeted analysis of anthocyanins and other flavonoids (MRM). What else is different? –Run samples (wild type v. mutant HL v. LL) on LC-QToF. –Identify potential compounds in each sample using molecular feature extraction (MFE) in MassHunter: ~3000 “compounds”. –Align features (mass/retention time pairs) across samples (Perera-Yang method). –Statistical analysis to identify differentially expressed features. Check MFE data to confirm. Identify features from accurate mass/isotope abundance and MS/MS spectra. Use m/z, retention time and MS/MS data to set up specific assays by MRM using QQQ.
 on LC-QToF. –Identify potential compounds in each sample using molecular feature extraction (MFE) in MassHunter: ~3000 compounds . –Align features (mass/retention time pairs) across samples (Perera-Yang method). –Statistical analysis to identify differentially expressed features. Check MFE data to confirm. Identify features from accurate mass/isotope abundance and MS/MS spectra. Use m/z, retention time and MS/MS data to set up specific assays by MRM using QQQ..")
3
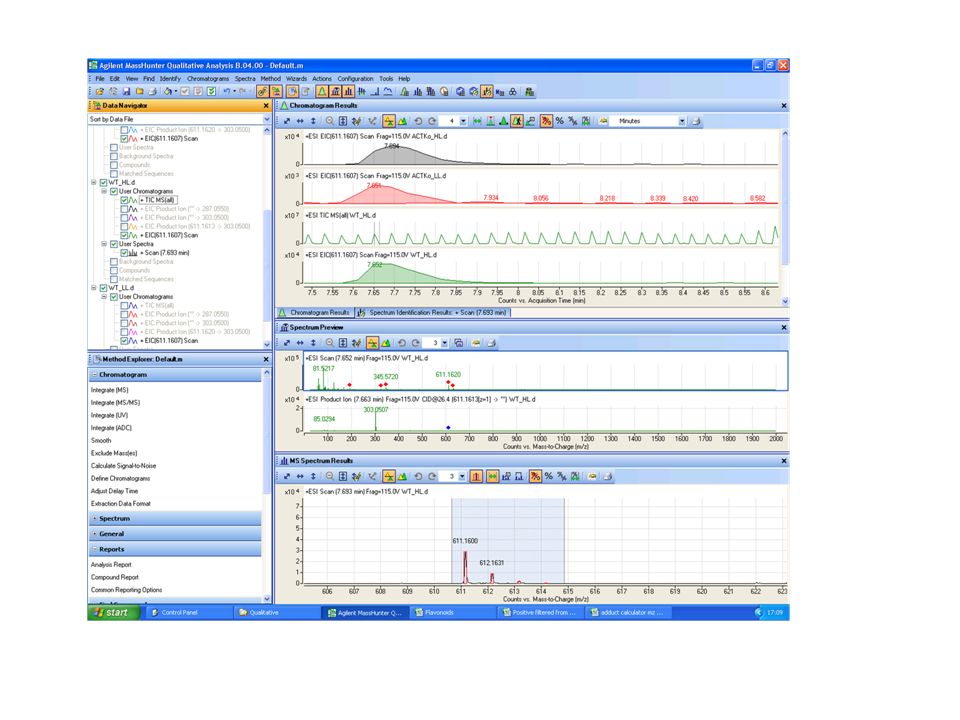
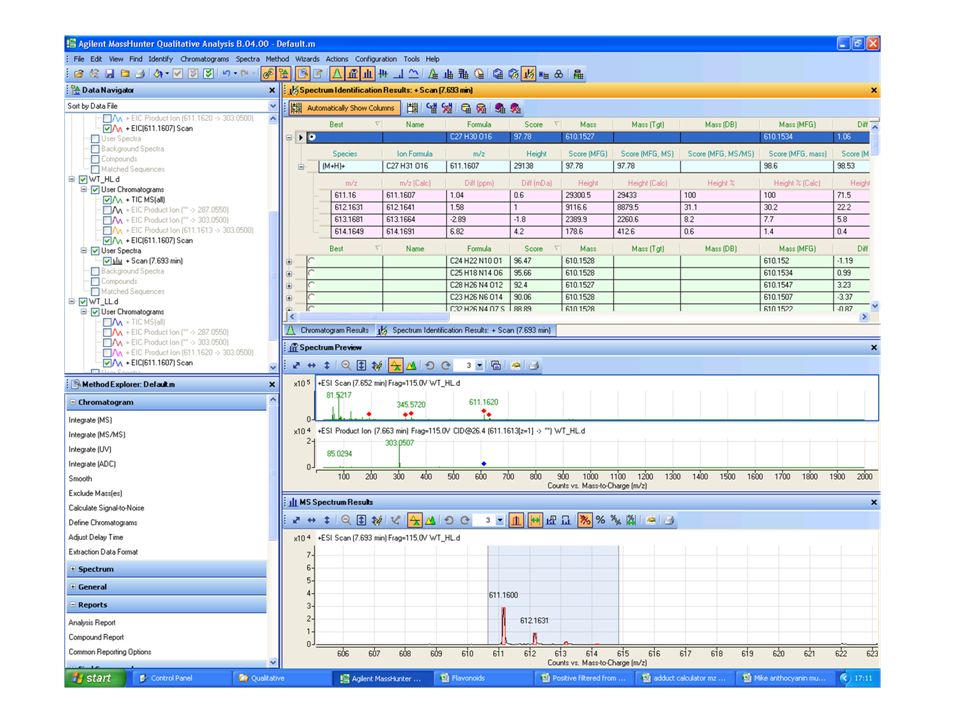
Total ion chromatograms of 4 samples Extracted ion chromatograms (EIC) from one sample
 from one sample")
4
Molecular feature extraction- identifies “compounds” by amalgamating charge states and adducts with the same chromatographic retention time.

5
Extracted compounds aligned across samples and compared. Hierarchical clustering compares abundance of compounds in mutant and WT plants grown in low and high light

6
Extracted compounds aligned across samples and compared. Hierarchical clustering compares abundance of compounds in mutant and WT plants grown in low and high light

10
Protein abundance – VTC2 precursor ion product ions MLKIKRVPTVVSNYQKDDGAEDPVGCGRNCLGACCLNGARLPLYACKNLVKSGEKLVISHEAIEPPVAFL ESLVLGEWEDRFQRGLFRYDVTACETKVIPGKYGFVAQLNEGRHLKKRPTEFRVDKVLQSFDGSKFNFT KVGQEELLFQFEAGEDAQVQFFPCMPIDPENSPSVVAINVSPIEYGHVLLIPRVLDCLPQRIDHKSLLLAV HMAAEAANPYFRLGYNSLGAFATINHLHFQAYYLAMPFPLEKAPTKKITTTVSGVKISELLSYPVRSLLFE GGSSMQELSDTVSDCCVCLQNNNIPFNILISDCGRQIFLMPQCYAEKQALGEVSPEVLETQVNPAVWEIS GHMVLKRKEDYEGASEDNAWRLLAEASLSEERFKEVTALAFEAIGCSNQEEDLEGTIVHQQNSSGNVN QKSNRTHGGPITNGTAAECLVLQ* counts acquisition time (mins)
")
11
6x His TRYPSIN detect by mass spectrometry precursor ions product ions * * * * * * * * * * * *** FRAGMENTATION in vitro translation with labelled amino acid (e.g. 13 C-Leu*) Spike plant extracts with a known quantity of labelled VTC2 Directly compare abundance with VTC2 present in leaf extract Spike plant extracts with multiple biosynthetic proteins – simultaneous quantification Detect mass difference between labelled and unlabelled protein Protein abundance – VTC2
 Spike plant extracts with a known quantity of labelled VTC2 Directly compare abundance with VTC2 present in leaf extract Spike plant extracts with multiple biosynthetic proteins – simultaneous quantification Detect mass difference between labelled and unlabelled protein Protein abundance – VTC2.")
Similar presentations


 Course Director David Fenyö Contact information>")
 Course Director David Fenyö Contact information>")


 Standardization important Reporting important, but has to be feasible Does not matter which MS instrument.>")
