Download presentation
Presentation is loading. Please wait.

2
Improvement Tools Interactive Lecture

3
Tools Offer Assistance Understand the current state of a process Determine whether the process is in control Find Solutions & Root Cause Analysis (7 Basic Tools) Check SheetsControl ChartsCause-and-Effect Diagram FlowchartsScatter DiagramsRun Chart HistogramsScatter Diagram Flowchart Pareto Chart Histogram Control Chart
 Check SheetsControl ChartsCause-and-Effect Diagram FlowchartsScatter DiagramsRun Chart HistogramsScatter Diagram Flowchart Pareto Chart Histogram Control Chart")
4
Affinity Diagram http://annexsite.files.wordpress.com/2012/04/the2b20122bhandbook2bfor2bquality.pdf http://www.syque.com/quality_tools/toolbook/Affinity/example.htm

5
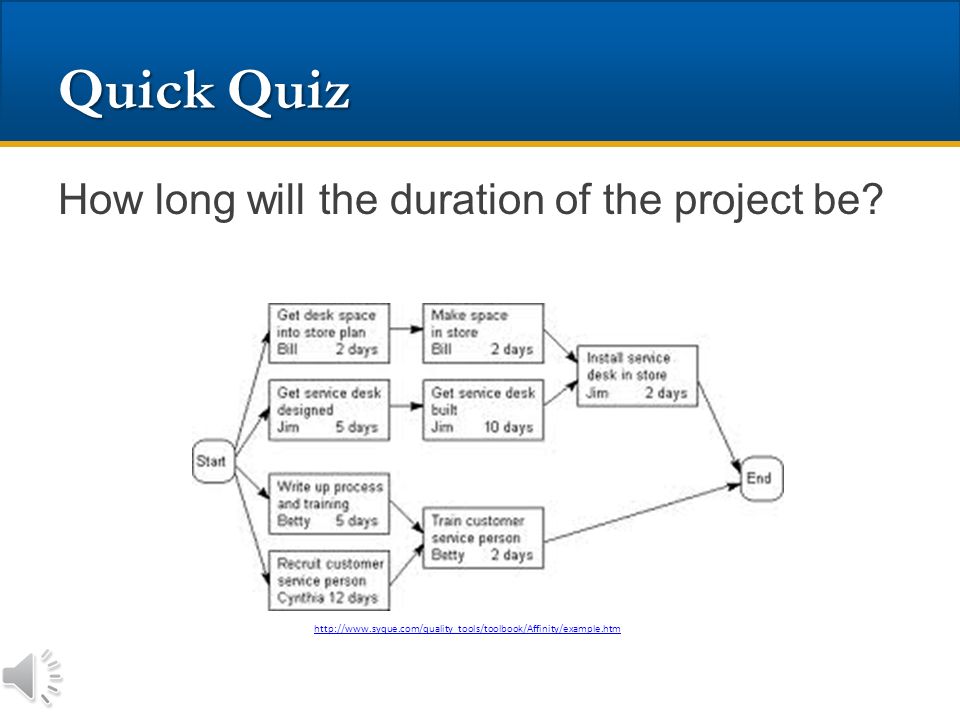
Arrow Diagram A sequenced plan and a tool for monitoring progress. http://www.syque.com/quality_tools/tools/TOOLS15.htm
6
Quick Quiz How long will the duration of the project be? http://www.syque.com/quality_tools/toolbook/Affinity/example.htm
7
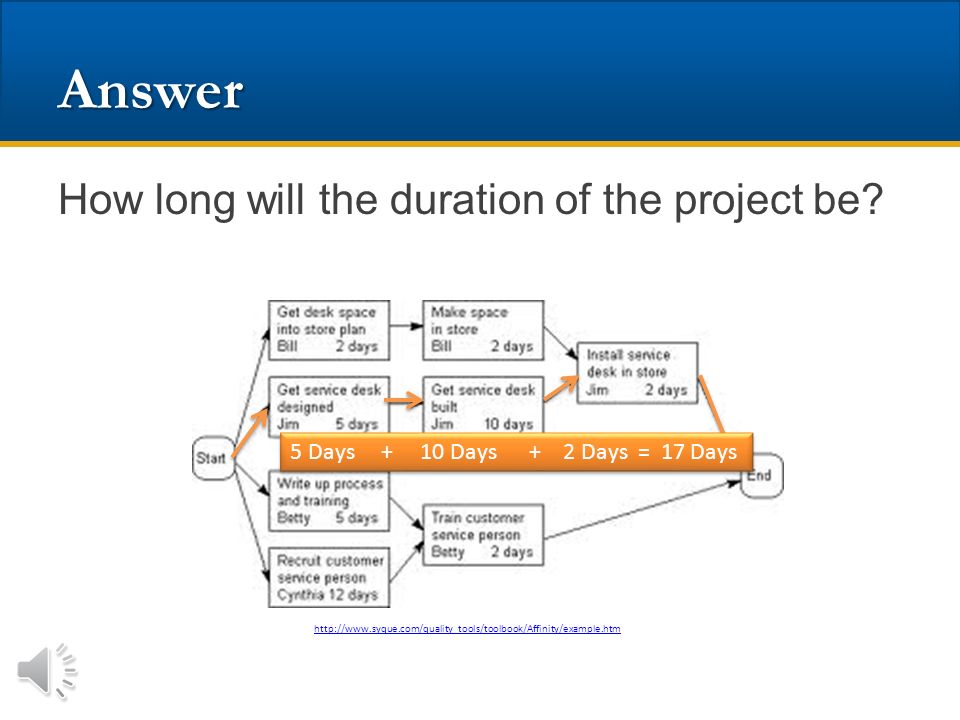
Answer How long will the duration of the project be? http://www.syque.com/quality_tools/toolbook/Affinity/example.htm 5 Days + 10 Days + 2 Days = 17 Days

8
Audit Planned arrangements are effectively implemented –Scheduled –Indicate necessary improvement and corrective actions –Effectiveness of processes and assigned responsibilities –Should be carried out by someone unrelated to the process

9
Audit First-party assessment or internal audit –By the organization’s own employees Second-party audit –External customer makes an assessment of a supplier Third-party audit –Independent organization that is not connected with any contract between the customer and supplier

10
Bar Chart A bar chart shows the number of units in each category –Examples: Histogram Pareto chart http://4.bp.blogspot.com/-fDetqIvrB78/T3nkptplevI/AAAAAAAAADc/uo9AseSn8BU/s1600/histog2.gif

11
Benchmarking What is benchmarking? Different Approaches: Competitive, Functional, Performance, Process, and Strategic. Principles of Operations Management, Heizer & Render. Pearson Prentice Hall, 2008 http://pulpaddict.com/wp-content/uploads/2013/12/ac2c0409fer.jpg

12
Benchmarking Example: Resolving Customer Complaints Best PracticeJustification Make it easy for clients to complain.It is free market research. Respond quickly to complaints.It adds customers and loyalty. Resolve Complaints on the first contact.It reduces cost. Use computers to manage complaintsDiscover trends, share them, and align your services. Recruit the best for customer service jobs It should be part of formal training and career advancement Principles of Operations Management, Heizer & Render. Pearson Prentice Hall, 2008

13
Brainstorming Generate ideas in a nonjudgmental environment. Rules 1.Never Judge ideas 2.Don’t quit 3.Try to write down all of the idea exactly as presented 4.Encourage outrageous ideas 5.Have a diverse group http://annexsite.files.wordpress.com/2012/04/the2b20122bhandbook2bfor2bquality.pdf

14
Cause-and-Effect diagram AKA Fishbone or Ishikawa diagram Illustrates the relationship between a given outcome and all the factors that influence the outcome. Read the steps on pgs. 117-118 of your textbook http://annexsite.files.wordpress.com/2012/04/the2b20122bhandbook2bfor2bquality.pdf

15
Check Sheet Form used to perform frequency of specific events during a data collection period. http://en.wikipedia.org/wiki/Check_sheet

16
Consensus A form of group decision making in which everyone agrees – or at least can live -- with the decision. http://www.energynext.in/wp-content/uploads/2013/08/feedback-buttons.jpg
17
Continuous Quality Improvement http://jewzi.com/wp-content/uploads/2011/08/leadership.jpg

18
Control Chart Used to measure sequential or time- related process performance and variability –Line chart with control limits –Statistical variation

19
Control Chart – Figure 1 http://asq.org/learn-about-quality/data-collection-analysis-tools/overview/control-chart.html

20
Types of Data http://managementhelp.org/blogs/quality/files/attribute-and-variable-type-data.jpg

21
Cost of Quality http://www.isixsigma.com/implementation/financial-analysis/cost-quality-not-only-failure-costs/

22
Design of Experiments (DOE) Structured way to characterize processes. –Analyze a process and identify key characteristics or factors that most impact the quality of the end item. –Run limited tests, collect data, and analyze –Which factors contribute the most to final quality and define the parameter setting for those factors –Start in the earliest stage of design

23
Five Whys http://www.handsongroup.com/wp-content/uploads/2012/05/five-whys-example-chart.png

Similar presentations


 Professional Learning Communities (Self Audit) School Improvement Snapshot School Improvement.>")

>")


