Download presentation
Presentation is loading. Please wait.

1
The Obesity Epidemic and The Government’s Response Karyl Thomas Rattay MD, MS Office of Disease Prevention and Health Promotion October 15, 2003

2
Chronic Disease Epidemic

3
Obesity Trends* Among U.S. Adults BRFSS, 1991, 1995 and 2000 (*BMI 30, or ~ 30 lbs overweight) 19911995 2000 Source: Mokdad A H, et al. J Am Med Assoc 1999;282:16, 2001;286:10. No Data <10% 10%-14% 15-19% 20%
 Source: Mokdad A H, et al. J Am Med Assoc 1999;282:16, 2001;286:10. No Data <10% 10%-14% 15-19% 20%.")
4
A Real and Consequential Epidemic Overweight Facts 64% adults are overweight or obese (BMI> 25) 15% children & adolescents (aged 6 to 19) are overweight (> 95 th percentile) associated with many chronic diseases, especially type 2 diabetes $117 billion total cost (2000) 300,000 deaths a year may be attributable to obesity Overweight Trends Obesity (BMI> 30) in adults has nearly doubled Overweight in children has doubled Overweight in adolescents has tripled Increases across all ages, racial and ethnic groups, both genders If not arrested will account for more m&m than tobacco
 15% children & adolescents (aged 6 to 19) are overweight (> 95 th percentile) associated with many chronic diseases, especially type 2 diabetes $117 billion total cost (2000) 300,000 deaths a year may be attributable to obesity Overweight Trends Obesity (BMI> 30) in adults has nearly doubled Overweight in children has doubled Overweight in adolescents has tripled Increases across all ages, racial and ethnic groups, both genders If not arrested will account for more m&m than tobacco")
5
Eat, Drink and be Merry? premature death type 2 diabetes heart disease stroke hypertension abnormal cholesterol cancer: colon, breast complications of pregnancy menstrual irregularities gallbladder disease osteoarthritis sleep apnea increased surgical risk asthma hirsutism psychological disorders social stigmatization Adapted from www.niddk.nih.gov/health/nutrit/pubs/statobes.htm26

7
INTAKE OUTPUT MAINTAIN WEIGHT OUTPUT INTAKE LOSE WEIGHT INTAKE OUTPUT GAIN WEIGHT Determinants of Weight Status

8
The Best Prescription R xprevention

9
The Call to Action to Prevent and Decrease Overweight and Obesity The Call to Action to Prevent and Decrease Overweight and Obesity “…it’s all about health not appearance…” www.SurgeonGeneral.gov

10
A Wake Up Call More than 1.7 million Americans die of a chronic disease each year Chronic diseases account for 2/3 of years lost due to premature death More than 125 million Americans live with chronic conditions, and millions of new cases are diagnosed each year Chronic diseases account for 75% of the $1.4 trillion we spend on healthcare

11
Federal Prevention Initiatives New Initiatives HealthierUS Steps to a HealthierUS Established Programs Healthy People 2010 Dietary Guidelines for Americans

12
HealthierUS Mission Four Health Pillars: Be physically active every day Eat a nutritious diet Get preventive screenings Make healthy choices Prevent a tremendous amount of disease, disability and death to help Americans lead safer, healthier, longer lives

13
Actions Around HealthierUS Reinvigoration of the President’s Council on Physical Fitness and Sports Partnerships within the Federal Government HealthierChildren and Youths Public Health and Recreation 5 A Day

14
Steps to a HealthierUS Secretary Thompson’s Prevention Initiative Envisions a nation where diseases are prevented when possible, controlled when necessary, and treated when appropriate

15
Steps to a HealthierUS Reducing Burden of Disease Obesity Diabetes Asthma Addressing Risk Factors Nutrition Physical activity Tobacco use

16
Steps Will Support Community initiatives to promote and enable healthy choices Collaboration with the private sector, healthcare groups, and insurance systems to target reduction of risk factors and complications of chronic disease Cooperation among policy makers to invest in disease prevention and health promotion Health promotion programs to motivate and support responsible health choices State and federal policies that invest in the promise of prevention of all Americans

17
HHS Agencies Involved With Steps Administration on Aging Administration for Children and Families Agency for Healthcare Research and Quality Centers for Disease Control and Prevention Centers for Medicare and Medicaid Services Food and Drug Administration Health Resources and Services Administration Indian Health Service National Institutes of Health Office of Disease Prevention and Health Promotion Substance Abuse and Mental Health Services Administration

18
National Prevention Summit 2003 Steps to a HealthierUS Launched Putting Prevention First Secretary Thompson Laid-out priorities and program Over 1000 attendees Every facet of the health industry represented

19
Steps Prevention Portfolio Available at www.healthierus.gov/steps Power of Prevention Prevention Strategies that Work Prevention Programs in Action

20
Steps Grants Program - RFA 5-year cooperative agreement program Sponsored by HHS, acting through CDC and combining strengths and resources of all relevant HHS agencies and programs Innovative and effective community-based chronic disease prevention and control programs

21
Steps RFA – Community Interventions Engage community members in assessments, planning, delivery, and evaluation Improve strategic communication through media and IT Develop supportive environments and social support to sustain individual change efforts Improve access to and utilization of quality health care services

22
Steps RFA – School Interventions Establish fulltime school health coordinator or council Provide adequate physical education for all students Implement professional development and staff wellness programs Ensure healthy choices wherever food and drinks are provided in schools Establish tobacco-free school environments

23
Steps RFA - Timeline May 9 May 9 RFA Published in the Federal Register May 22 May 22 Pre-Application Broadcast June 2 June 2 Letters of Intent Due July 15 July 15 Applications Due September 18 September 18 Awards Made Visit www.HealthierUS.Gov for More Information

24
STEPS Awardees Representing 23 Communities State-coordinated Small Cities/Rural Communities WA—4 counties AZ—3 counties CO—4 counties NY—4 counties Tribes/Tribal Entities Intertribal Council Of Michigan Large Cities/Urban Communities Seattle-King County, WA Salinas-Monterey County, CA Austin-Travis County, TX New Orleans, LA St. Petersburg-Pinellas County, FL Boston, MA Philadelphia, PA

25
Snapshot of Steps Interventions New Orleans –Develop bicycle/pedestrian plans for individual neighborhoods Boston –Implement changes to improve delivery of preventive services like interactive risk assessment tools, patient registries and provider reminders Philadelphia –Develop a comprehensive system of after-school health clubs, nutrition education programs, and physical education to promote wellness

26
Other Steps Activities Reach out to private partners Business summit and industry specific roundtables Launch National Diabetes Initiative 5.9 million undiagnosed 2 nd Annual Prevention Summit

27
2 nd National Summit Steps to A HealthierUS April 28 – 29, 2004 Baltimore Marriott Waterfront Baltimore, MD Contact Information Office of Disease Prevention and Health Promotion 202-401-6295 SAVE THE DATE

28
Healthy People 2010 A comprehensive set of national health objectives Developed as a ten-year plan www.healthypeople.gov

29
Healthy People 2010 2 Goals: –Increase Quality and Years of Healthy Life –Eliminate Health Disparities 467 specific objectives grouped into 28 focus areas The result of an extensively collaborative scientific process

30
Overweight and Obesity Overweight and obesity, United States,1988–94 *In those aged 6 to 19 years, overweight or obesity is defined as at or above the sex- and age-specific 95th percentile of Body Mass Index (BMI) based on CDC Growth Charts: United States. **In adults, obesity is defined as a BMI of 30 kg/m 2 or more; overweight is a BMI of 25 kg/m 2 or more. Source: Centers for Disease Control and Prevention, National Center for Health Statistics. National Health and Nutrition Examination Survey. 1988–94.

31
Healthy People 2010 Ongoing evaluation –Progress Reviews –Mid-Course Reviews –Developmental Objectives

33
Dietary Logic? The Japanese eat very little fat and suffer fewer heart attacks than the British or Americans. The French eat a lot of fat and also suffer fewer heart attacks than the British or Americans. The Japanese drink very little red wine and suffer fewer heart attacks than the British or Americans. The Italians drink excessive amounts of red wine, and also suffer fewer heart attacks than the British or Americans.

34
Dietary Logic? Conclusion: Eat & drink what you like. It's speaking English that kills you.

35
Dietary Guidelines for Americans Science-based advice for ages 2+ Promote health Prevent chronic disease Federal nutrition policy/ programs Vehicle to speak with one voice “Gold standard” HHS/USDA

36
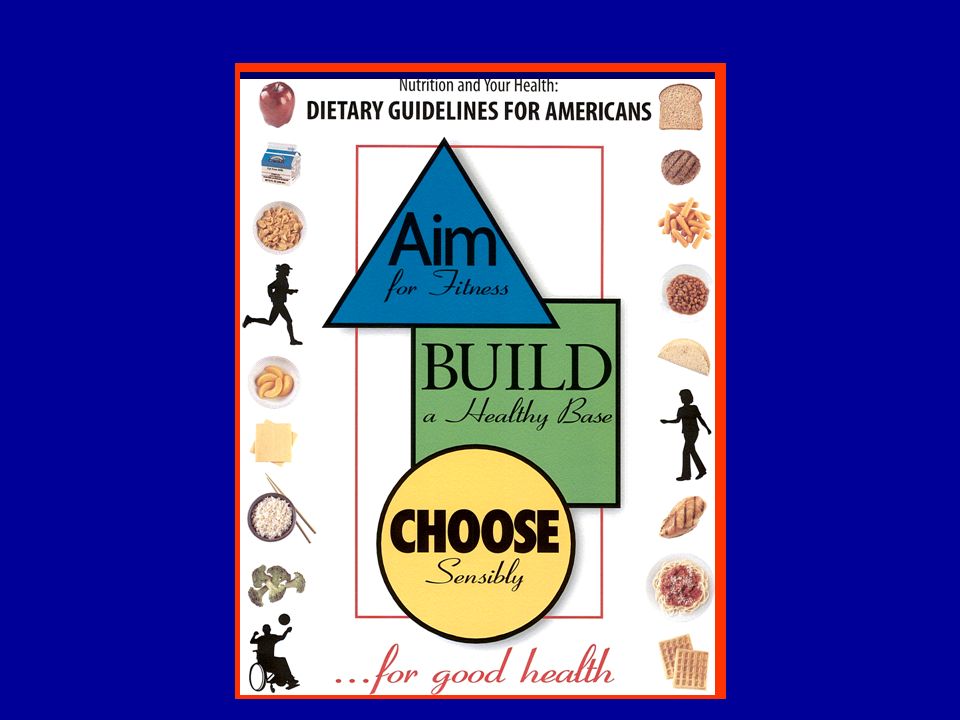
1980 1985 1990 1995 Figure 1. Covers of the first 4 editions of the Dietary Guidelines for Americans

39
Aim for Fitness Aim for a healthy weight Be physically active each day

40
Health benefits of physical activity Physical activity recommendations Adults -- 30 minutes of moderate physical activity most, preferably all, days of the week Children -- 60 minutes of moderate physical activity daily

41
Build a Healthy Base Let the Pyramid guide your food choices Choose a variety of grains daily, especially whole grains Choose a variety of fruits and vegetables daily Keep food safe to eat

42
Fats, Oils, & Sweets USE SPARINGLY Milk, Yogurt, & Cheese Group 2-3 SERVINGS Vegetable Group 3-5 SERVINGS Meat, Poultry, Fish Dry Beans, Eggs & Nuts Group 2-3 SERVINGS Fruit Group 2-4 SERVINGS Bread, Cereal, Rice, & Pasta Group 6-11 SERVINGS Food Guide Pyramid A Guide to Daily Food Choices Source: U.S. Department of Agriculture/U.S. Department of Health and Human Services KEY Fat (naturally occurring and added) Sugars (added) These symbols show fat and added sugars in foods
 Sugars (added) These symbols show fat and added sugars in foods.")
43
Recommended number of servings

44
Choose Sensibly Choose a diet that is low in saturated fat and cholesterol and moderate in total fat Choose beverages and foods to moderate your intake of sugars Choose and prepare foods with less salt If you drink alcoholic beverages, do so in moderation

45
Choose a diet that is low in saturated fat and cholesterol and moderate in total fat Total fat recommendation: 30% of calories or less Descriptions of the different types of fat Limits on saturated fat and total fat for various calorie levels Comparison of saturated fat content of foods

46
Calories Total fat in grams Saturated fat in grams Cholesterol in milligrams Sodium in milligrams Nutrients in one serving. The “ % Daily Value” shows you how much of the recommended amounts the food provides in one serving, Here is the recommended daily amount for each nutrient for two calorie levels. Serving Number of servings

47
Goal of Dietary Guidelines IMPROVE HEALTH BY: Increasing awareness Providing healthy options Promoting healthy choices

48
Consumer Understanding “Moderate” ”a reasonable amount” “the lowest possible amount” “some, but not a lot” “a small amount” “limit” “put that 3 rd donut away”

49
How are we doing? Only 3 percent of us meet 4 of the 5 recommendations for intake of grains, fruits, vegetables, dairy products, and meats Less than 20% teenage girls get enough calcium 35% of adolescents don’t get enough physical activity 43% of high schoolers watch more than 2 hours of TV per day

50
Taking Steps Together “The function of protecting and developing health must rank even above that of restoring it when it is impaired. ” Hippocrates

51
Karyl Thomas Rattay Kthomas@osophs.dhhs.gov

Similar presentations