Download presentation
Presentation is loading. Please wait.

2
I. Types of Errors: Systematic Random 11.1.1 http://www.youtube.com/watch?v=50iFTcCsG_Y&feature=relmfu http://chemwiki.ucdavis.edu/Analytical_Chemistry/Quantifying_Nature/Uncertainties_in_Measurements

3
Science, Measurement, Uncertainty and Error 3 Measurements are rarely exactly the same. Measurements are always somewhat different from the “true value.” These deviations from the true value are called errors.

4
Two sources of error in a measurement are limitations in the sensitivity of the instruments imperfections in experimental design or measurement techniques Errors are often classified as: Systematic Random www.nabis.govt.nz

6
11.1.1 http://www.youtube.com/watch?v=50iFTcCsG_Y &feature=relmfu

7
Systematic errors result in readings all being shifted too high, or too low. All the data is off in the same direction.They can be: a. Personal errors: This type of error can be greatly reduced if you are familiar with the experiment you are doing.(wrong choice of calorimeter) b. Instrumental Errors: Instrumental errors are attributed to imperfections in the tools with which the analyst works. For example, volumetric equipment such as burets, pipets, and volumetric flasks frequently deliver or contain volumes slightly different from those indicated by their graduations. Calibration can eliminate this type of error.
 b. Instrumental Errors: Instrumental errors are attributed to imperfections in the tools with which the analyst works. For example, volumetric equipment such as burets, pipets, and volumetric flasks frequently deliver or contain volumes slightly different from those indicated by their graduations. Calibration can eliminate this type of error..")
8
Systematic errors result in readings all being shifted too high, or too low. Systematic Error may be due to the apparatus itself, or to the way in which readings are taken. A systematic error, would include consistent errors that always arise. Example 1: Readings should always be volumes made to the bottom point of the meniscus.

9
Example 2: Calibration, when feasible, is the most reliable way to reduce systematic errors. adjust the scale to read zero when there is nothing on it.

10
Dissolving NaOH in water.

14
Random errors arise from the imprecision of measurements and can lead to readings being above or below the “true” value. Random errors can be reduced with the use of more precise measuring equipment or its effect minimized through repeating measurements so that the random errors cancel out. Random errors are the major source of uncertainty. (keep this thought)
.")
15
You measure the mass of a ring three times using the same balance and get slightly different values: 17.46 g, 17.42 g, 17.44 g Volume measurements made with a 50-mL beaker are accurate to within ±5 mL. In other words, you would be as likely to obtain 20 mL of solution (5 mL too little) as 30 mL (5 mL too much). You could decrease the amount of error by using a graduated cylinder, which is capable of measurements to within ±1 mL. The error could be decreased even further by using a buret, which is capable of delivering a volume to within 1 drop, or ±0.05 mL.
 as 30 mL (5 mL too much). You could decrease the amount of error by using a graduated cylinder, which is capable of measurements to within ±1 mL. The error could be decreased even further by using a buret, which is capable of delivering a volume to within 1 drop, or ±0.05 mL..")
17
Show burette/titration and give IB question Hodder Assignment page 324 # 10

21
Random Uncertainties Youtube 11.1.4 State random uncertainty as an uncertainty range (+/-) IB Chemistry http://www.youtube.com/watch?v=XcaYc9xr9- k&feature=related http://www.youtube.com/watch?v=XcaYc9xr9- k&feature=related
 IB Chemistry v=XcaYc9xr9- k&feature=related v=XcaYc9xr9- k&feature=related")
22
The true value of the measure is never known A value is assigned based on an estimate, within a certain level of confidence This results in a range of possible values © CSIR 2006 www.csir.co.za

23
Remember that all measurements contain three parts: The measurement The uncertainty The unit

24
A measurement always has some degree of uncertainty. How long is this nail?

25
Different people estimate differently. Record all certain numbers and one estimated number. Whenever we measure in chemistry we always record one extra decimal place (estimated number) beyond the markings on the measurement device.
 beyond the markings on the measurement device..")
26
The uncertainty of this measure would be defined as 1/2 the smallest division, 1/2 of 1 mL = 0.5 mL. So, the true measure should lie either 0.5 mL above or 0.5 mL below our measurement. We would say then our measure is 43.5 ± 0.5 mL.

27
InstrumentTypical Uncertainty Typical Digital Balance0.01 g Analytical balance0.002 g -10 ˚C to 110˚ C thermometer0.2 ˚C 10 mL graduated cylinder0.05 mL 100 mL graduated cylinder0.5 mL 50 mL buret0.05 mL 1 mL pipet0.01 mL 10 mL pipet0.02 or 0.05 mL 25 mL pipet0.03 mL 100 mL flask5 125 mL flask10 mL

28
– This is the simple uncertainty in the value itself. The absolute uncertainty has the same units as the value. 3.8 cm ± 0.1 cm ( 3.8 ± 0.1) cm Usually reported with one significant figure http://scidiv.bellevuecollege.edu/Physics/Measure%26sigfigs/F-Uncert-Percent.html www.chemactive.com
 cm Usually reported with one significant figure")
29
– This is the simple ratio of uncertainty to the value multiplied by 100. As a ratio of similar quantities, the relative uncertainty has no units. For example the percentage uncertainty of 28.50 ± 0.05g is %u = ( 0.05/28.50) x 100 = 0.18% You report as 28.50g ± 0.18% Note that it is acceptable to report percent uncertainties to two significant figures.
 x 100 = 0.18% You report as 28.50g ± 0.18% Note that it is acceptable to report percent uncertainties to two significant figures..")
30
The uncertainties in individual measurements can be combined to calculate the uncertainty in the final value of the quantity being determined. – In addition and subtraction: Add absolute uncertainties – In multiplication, division and powers: Add percentage uncertainties – If one uncertainty is much larger than the others, ignore the other uncertainties and estimate the uncertainty based on the larger one using the rules above. www.chemactive.com

31
Find the difference in temperature. Initial temp. = 34.50 ± 0.05 o C Final Temp. = 45.21 o C ± 0.05 o C

32
ΔT= 45.21 -34.5 =10.71 o C u = ± 0.05 + 0.05 = ± 0.10 o C ΔT = 10.71 ± 0.10 o C = 10.7 ± 0.1 o C Absolute Uncertainties usually have one significant figure.

34
If you multiply the variable, of course the uncertainty also increases appropriately. Suppose you had x = 4.5 ±0.1, that is, the uncertainty = 0.2, since the measurement could be anywhere between 4.4 and 4.6 If you now look at 5x, then the result could be anywhere between 5(4.4) = 22.0, and 5(4.6) = 23.0. So the uncertainty in 5x is 1.0, or 5 times the uncertainty in x. That is, 5x = 22.5 ±0.5.
 = 22.0, and 5(4.6) = So the uncertainty in 5x is 1.0, or 5 times the uncertainty in x. That is, 5x = 22.5 ±0.5..")
39
If the % Error is greater than the % uncertainty, systematics errors are more significant than random errors.

40
A student performs an experiment to determine the heat of a reaction, ΔH. A certain mass of a metal at (95.5 +- 0.5) ° C was placed into (150.25 +- 0.05)g of water in the calorimeter. The temperature went down to 37.5 ˚C. What is the heat of reaction in kJ ? Literature value:48 kJ
 ° C was placed into ( )g of water in the calorimeter. The temperature went down to 37.5 ˚C. What is the heat of reaction in kJ . Literature value:48 kJ.")
42
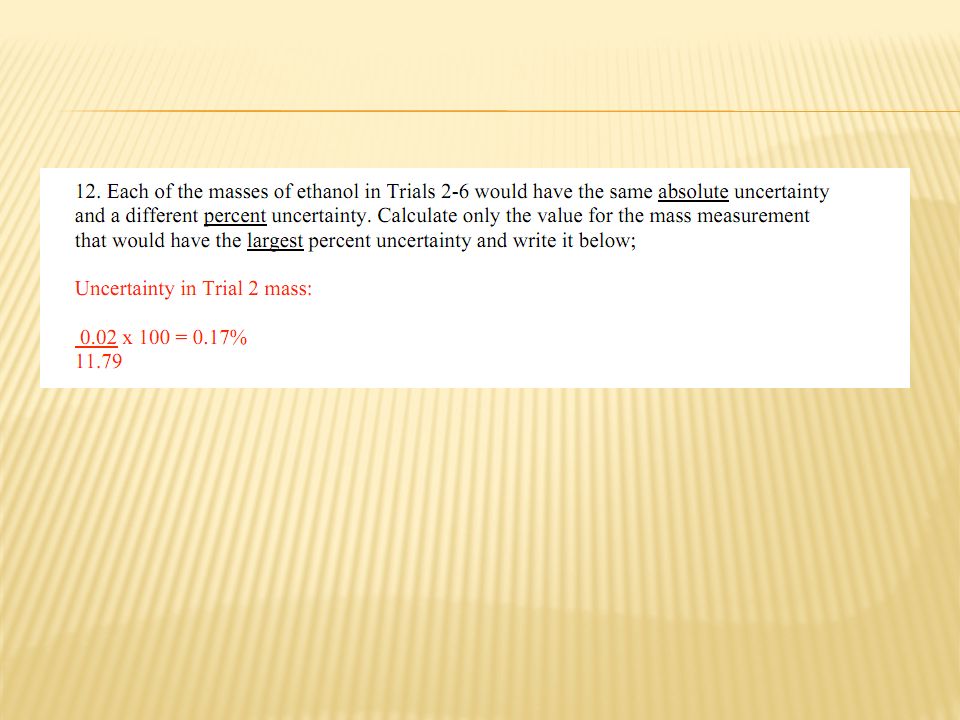
Average Values When several trials are performed in an investigation, each set of data obtained should be used to make a separate calculation of the desired quantity. If the raw data from one trial varies greatly from other trial data then this should NOT be included but an explanation should be given as to why it was not included. Once calculations have been made for each trial separately, then you should determine the average value, with appropriate uncertainty. You can disregard trials 1 and 5. If it not the case, consider the highest percent uncertainty of all trials.

46
Justify their conclusion by discussing whether systematic errors or further random errors were encountered. The direction of any systematic errors should be appreciated. The percentage error should be compared with the total estimated random error as derived from the propagation of uncertainties (conclusion and evaluation: aspect 1). comment about the precision and accuracy of the measurements when evaluating their procedure (conclusion and evaluation: aspect 2) suggest how the effects of random uncertainties may be reduced and systematic errors be eliminated. Students should be aware that random, but not systematic, errors are reduced by repeating readings (conclusion and evaluation: aspect 3)
. comment about the precision and accuracy of the measurements when evaluating their procedure (conclusion and evaluation: aspect 2) suggest how the effects of random uncertainties may be reduced and systematic errors be eliminated. Students should be aware that random, but not systematic, errors are reduced by repeating readings (conclusion and evaluation: aspect 3).")
47
Assignment : Percent Uncertainty Example

48
Determine from graphs physical quantities (with units) by measuring and interpreting a slope (gradient) or intercept. When constructing graphs from experimental data, students should make an appropriate choice of axes and scale, and the plotting of points should be clear and accurate. (Millimeter square graph paper or software is appropriate. Quantitative measurements should not be made from sketch graphs.) The uncertainty requirement can be satisfied by drawing best-fit curves or straight lines through data points on the graph (data collection and processing: aspect 3). (Note: Chemistry students at SL and HL are not expected to construct uncertainty bars on their graphs and may achieve “complete” for aspect 3 of data collection and processing without them. However, students, probably those who also study IB physics, often construct error bars and there is no requirement to discourage them from doing so.)
 The uncertainty requirement can be satisfied by drawing best-fit curves or straight lines through data points on the graph (data collection and processing: aspect 3). (Note: Chemistry students at SL and HL are not expected to construct uncertainty bars on their graphs and may achieve complete for aspect 3 of data collection and processing without them. However, students, probably those who also study IB physics, often construct error bars and there is no requirement to discourage them from doing so.).")
49
Figure 1 is a graph of the gas law data showing the significant uncertainty. The computer drew the uncertainty bars based on the student entering the correct information, which in this case was 0.5 mm for each value. Figure 2 does not show the uncertainty bars. In chemistry, students are not expected to construct uncertainty bars. In both graphs the title is given (although it should be more explicit), and the student has labelled the axes and included units. The level of achievement for aspect 3 of data collection and processing for both graphs is complete = 2.
, and the student has labelled the axes and included units. The level of achievement for aspect 3 of data collection and processing for both graphs is complete = 2..")
Similar presentations


 Rubric IS the assessment statement.>")


