Download presentation
Presentation is loading. Please wait.

1
The North American Economy: Course Outline Overview of the US: geography, population, economy Economic history through to the end of post-WWII boom The rise of neo-liberalism in the US The “Great Moderation” and economic boom from the early 1990s to the mid-2000s The financial and economic crisis: origins and first results The financial and economic crisis: longer term results NAFTA, foreign trade policy, the US in the world economy Poverty, social inequality and the 99% The Canadian Economy, OCAs, a different banking system

2
The USA: a Continental Economy

3
Major cites (metropolitan areas) in millions (est. 2013) New York-Newark-New Jersey: 19.9 Los Angeles-Long Beach-Anaheim: 13.1 Chicago-Naperville- Elgin: 9.5 Dallas-Fort Worth-Arlington: 6.8 Houston-The Woodlands-Sugar Land: 6.3 Philadelphia-Camden-Willmington: 6.0 Source: US Bureau of Census estimates, etc, from Wikipedia
 New York-Newark-New Jersey: 19.9 Los Angeles-Long Beach-Anaheim: 13.1 Chicago-Naperville- Elgin: 9.5 Dallas-Fort Worth-Arlington: 6.8 Houston-The Woodlands-Sugar Land: 6.3 Philadelphia-Camden-Willmington: 6.0 Source: US Bureau of Census estimates, etc, from Wikipedia.")
4
Strengths of the US Economy 1)Capital stock in the US and overseas 2)Natural resources: fuel (gas, coal), metals, farm land, etc. 3)Technology 4)Monetary privilege – the dollar – financial system 5)Cultural hegemony (English, university system, audio- visual products) 6)Population growth 7)Stable political system 8)Military power Source: points 1 to 5 - Albert, M., Capitalisme contre capitalisme, Paris, Editions du Seuil, 1991.
Technology 4)Monetary privilege – the dollar – financial system 5)Cultural hegemony (English, university system, audio- visual products) 6)Population growth 7)Stable political system 8)Military power Source: points 1 to 5 - Albert, M., Capitalisme contre capitalisme, Paris, Editions du Seuil,")
5
Economy: Key Indicators 1 GDP $17,42 trillion (est 2014); 22% of world GDP, at market exchange rates 2014. GDP per capita $49,000 (2011 est.) Gini coefficient of family income: United States 0.45 (est 2007) France 32.7 (est 2008) Market value of publicly traded shares: $18.67 trillion (31 December 2012 est.) : ie 107% of GDP Source: CIA World Factbook, 2010 and other sources.
 Gini coefficient of family income: United States 0.45 (est 2007) France 32.7 (est 2008) Market value of publicly traded shares: $18.67 trillion (31 December 2012 est.) : ie 107% of GDP Source: CIA World Factbook, 2010 and other sources..")
6
Economy: Key Indicators 2 GDP composition by sector agriculture: 1.2% industry: 19.2% services: 79.6% (2011 est.) Labor force by occupation farming, forestry, and fishing: 0.7% manufacturing, extraction, transportation, and crafts: 20.3% managerial, professional, and technical: 37.3% sales and office: 24.2% other services: 17.6%
 Labor force by occupation farming, forestry, and fishing: 0.7% manufacturing, extraction, transportation, and crafts: 20.3% managerial, professional, and technical: 37.3% sales and office: 24.2% other services: 17.6%")
7
Economy: Key Indicators 3 Net stock of fixed assets and consumer durables: $55.9 trillion (2013, source BEA) Stock of FDI at home: $2.571 trillion (end 2011 est.) Stock of FDI abord: $4.314 trillion (end 2011 est.) Proved oil reserves: 20.68 billion bbl (begin. 2011 est.) – 13 th in world Proved natural gas reserves: 7.716 trillion cu m (begin.2009 est.) – 5th in world
 – 13 th in world Proved natural gas reserves: trillion cu m (begin.2009 est.) – 5th in world.")
8
U.S. assets were $25,324.4 billion at the end of the first quarter U.S. liabilities $32,118.3 billion. Source: Bureau of Economic Analysis, Press release, BEA, June 30, 2015.

9
First quarter of 2015: net position was -$6,794.0 billion

10
Population growth over time 1990: 250.1 m – 2007: 300 m > mid-2020s maybe 350 m Source: Economic Report of the President, 2013.

11
Population 321.4 million (July 2015 est.) Growth rate 0.78% (2015 est) (0.977% 2010 est) Births: 13.68 births/1,000 population (2012 est.) Fertility rate: 2.06 children born/woman (2012 est.) Net migration: 3.62 /1,000 population (2012 est.) Life expectancy: total population: 78.49 years male: 76.04 years female: 81.05 years (2012 est.) Demographic breakdown, est 2011 (2006) 0-14 years: 20.1% (20.4%): 15-64: 66.8% (67%) 65 years and over: 13.1% (12.5%) Source: CIA World Factbook, United States. Population characteristics 1

12
Population characteristics 2 Ethnic groups (est. 2010) White 79.96%Ameridian/Alaska: 0.97% Black 12.85%Hawaii/Pacific 0.18% Asian 4.43% (“Hispanic” 15. 1%) Languages: English 82.1% Spanish 10.7% (2000 census) Religious composition Protestant 51.3%, Catholic 23.9%, Other Christ. 1.6%, Jewish 1.7%, Muslim 1% Unaffiliated 12.1%, 10% (2007 est)
 White 79.96%Ameridian/Alaska: 0.97% Black 12.85%Hawaii/Pacific 0.18% Asian 4.43% ( Hispanic 15. 1%) Languages: English 82.1% Spanish 10.7% (2000 census) Religious composition Protestant 51.3%, Catholic 23.9%, Other Christ. 1.6%, Jewish 1.7%, Muslim 1% Unaffiliated 12.1%, 10% (2007 est).")
13
US Mean Center of Population 1790-2010 (wikipedia)
")
14
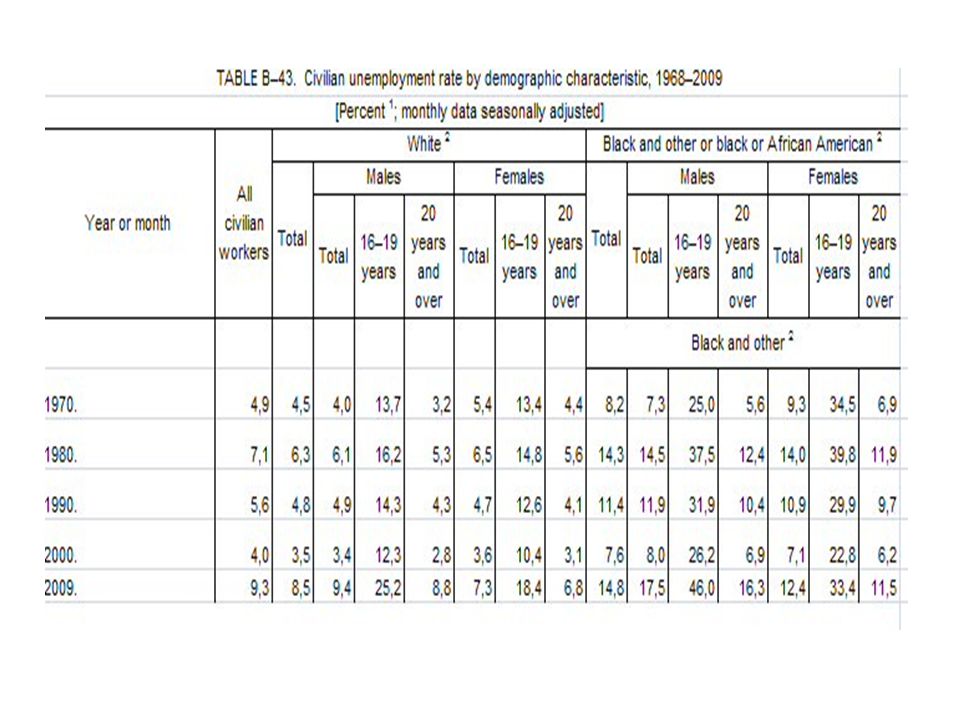
Source: Economic Report of the President, 2015 TABLE B–11. Civilian population and labor force, 1929–2014—Continued [Monthly data seasonally adjusted, except as noted] Year or month Civilian noninstit utional populatio n 1 Civilian labor force Not in labor force Civilian labor force participat ion rate 2 Civilian employm ent/ populatio n ratio 3 Unemplo yment rate, civilian workers 4 Total Employment Unemplo yment Total Agricultu ral Nonagric ultural Thousands of persons 16 years of age and overPercent 2007.231 867153 124146 0472 095143 9527 07878 74366,063,04,6 2008.233 788154 287145 3622 168143 1948 92479 50166,062,25,8 2009.235 801154 142139 8772 103137 77514 26581 65965,459,39,3 2010.237 830153 889139 0642 206136 85814 82583 94164,758,59,6 2011.239 618153 617139 8692 254137 61513 74786 00164,158,48,9 2012.243 284154 975142 4692 186140 28312 50688 31063,758,68,1 2013.245 679155 389143 9292 130141 79911 46090 29063,258,67,4 2014.247 947155 922146 3052 237144 0689 61792 02562,959,06,2

15
Labor force participation rate Civilian population, 16 and over Source: Bureau of Labor Statistics,

17
GDP by industry: % of value-added Private industry, services and govt Source: Economic Report of the President, 2013

18
GDP by industry: % of value-added 1

21
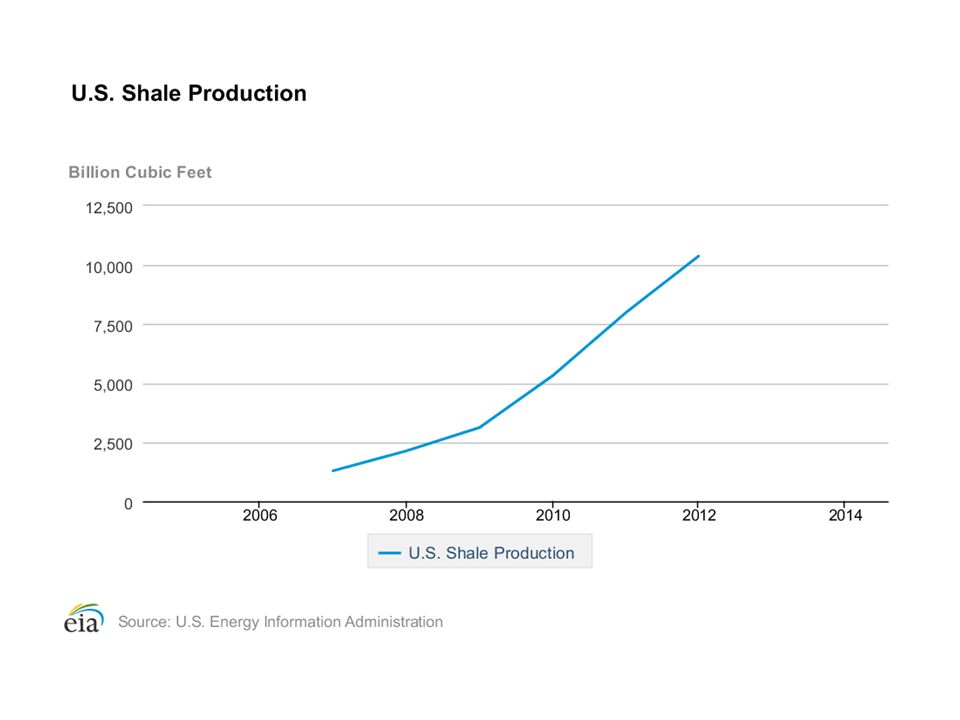
Source, Kate McKenzie, “US shale oil abundance: Bernstein vs. the IEA”, The Financial Times, November 19, 2012.

22
GDP by industry: % of value-added 2

23
Private consumption (2009: 56.9% of all consumption, $10.1 tn)
")
Similar presentations


 = $11,814.9B (5.5%) Q2: GDP = $2,914.38.>")


 After 1978, China opened its ‘iron door’ for market- oriented.>")


