Download presentation
Presentation is loading. Please wait.

1
Frequency Distributions Chapter 2

2
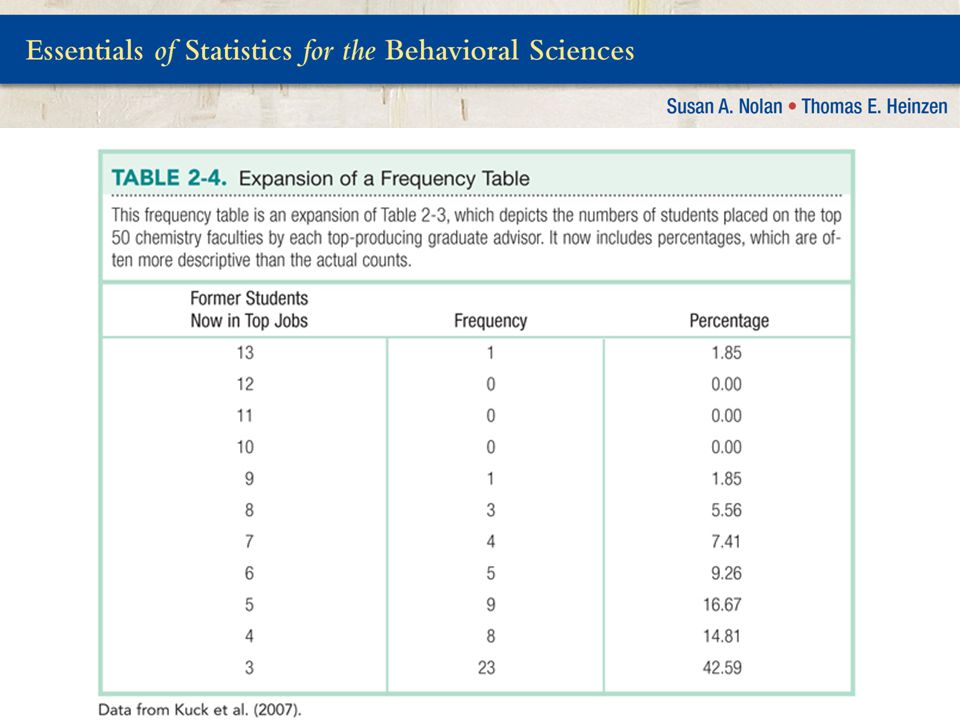
Distributions >Four different ways to visually describe just one variable Frequency table Grouped frequency table Frequency histograms Frequency polygon

6
Histogram for the Frequency Table of Graduate Advisors

7
Histogram for the Grouped Frequency Table of TV Pacing Index Data

8
Frequency Polygons as Another Graphing Option for the TV Pacing Index Data

9
>How old are the students in our class? Construct a frequency table; grouped frequency table; histogram; frequency polygon >What is the best method of presentation for our data? Check Your Learning

10
Shapes of Distributions >Normal distributions: Specific frequency distribution Bell shaped Symmetrical Unimodal

11
The Normal Distribution

12
>When our data are not symmetrical Positive: tail to the right >May represent floor effects Negative: tail to the left >May represent ceiling effects Memory hint: skew is where the tail is Skewed Distributions

13
Two Kinds of Skew

14
Everyone Improves

15
Helps the High Performers

16
Helps the Low Performers

Similar presentations