Download presentation
Presentation is loading. Please wait.

1
Created by: Krystal Barker, Teresa Campbell, Kim Grubb, and Tristan Parsons

2
I can interpret my GOLD data. I can use data to guide instruction in my classroom.

3
Visual representation of students abilities Shows progress over time Tracks progress Shows next steps

4
Data leads a teacher to be able to: Reflect on practices Generate new strategies to reach students Make good educational decisions Meet individual student needs Determine effectiveness of our teaching

5
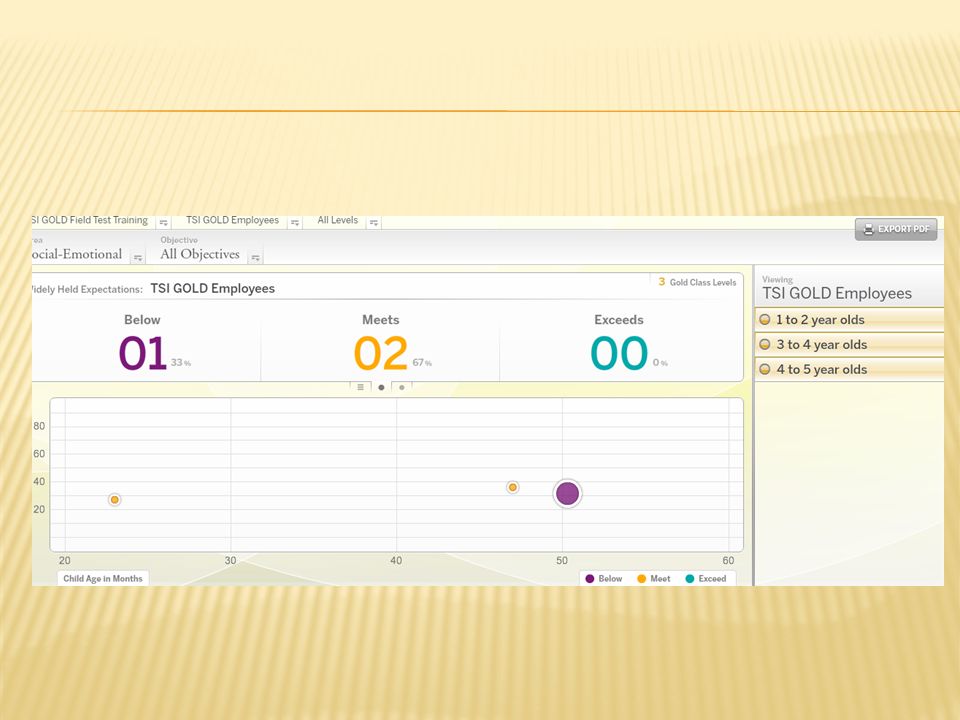
This report enables you to quickly see which children's skills are below, meeting, or exceeding widely held expectations that are defined by the color-coded age bands of Teaching Strategies GOLD ®. Widely Held Expectations Reports compare information about the knowledge, skills, and behaviors of an individual child, class, or other group with widely held developmental expectations for children of the same age or same class/grade This report uses data visualizations to display your child outcome information. These reports are visual representations that encourage you to investigate and explore the data so that the story it tells is clear and easy to understand.

6
Below—The numerical level assigned to the child for a given objective or dimension is lower than those of the appropriate colored band. For example, in the development and learning progression for Objective 1a, the green band spans levels 3, 4, 5, and 6. When, in relation to this dimension, the knowledge, skills, and behaviors of a child in a preschool 3 class are identified as Not Yet, level 1, or level 2, the child’s knowledge, skills, and behaviors are considered to be below widely held expectations for this dimension. Meets—The numerical level assigned to the child for a given objective or dimension is within those of the appropriate colored band. For example, for Objective 1a, the green band spans levels 3, 4, 5, and 6. When, in relation to this dimension, the knowledge, skills, and behaviors of a child in a preschool 3 class are at one of these levels, the child’s knowledge, skills, and behaviors meet widely held expectations for this dimension. Exceeds—The numerical level assigned to the child for a given objective or dimension is higher than those of the appropriate color band. For example, for Objective 1a, the green band spans levels 3, 4, 5, and 6. When, in relation to this dimension, the knowledge, skills, and behaviors of a child in a preschool 3 class are at level 7, 8, or 9, the child’s knowledge, skills, and behaviors exceed widely held expectations for this dimension.

11
While reviewing the Widely Held Expectations Report on GOLD, I noticed that four of my students scored below the benchmark for identifying rhyming words. I decide to bring this group together to play several rhyming games during centers. I utilize Assessment Opportunity Card-Listening Cords to address this need.

13
A Snapshot is a report option on GOLD, which displays scores of an individual child or group of children @ one point in time. It shows each child’s developmental level for a particular objective or dimension and the developmental levels expected of children of a particular age-group or class at the beginning and end of a program or school year. Charts can be created to show that a child / group of students / entire class is below, meeting, or exceeding for an area of development & learning; an objective; a dimension; or another outcome. Teachers can also filter based on important demographic information, such as special needs, language, length of time enrolled in the program, or ages and birthdays

15
Benchmarks 1. Baseline - My students are here… - High Expectations! - Plan of action / individualization– How can I best support all of my students so they can EXCEED my expectations? - Involving parents – activities… - Concerns for specific students? 2. Checkpoint - Monitor student progress!? - Reaffirm efforts!!! - Change of plans… 3. Final “Assessment” - Celebrate!!! - Share: Parents, Director, School, District, etc. - Summer packets… - Self-evaluation

16
1. Baseline - Where is my child? - Where should my child be now? - Strengths / Weaknesses - Concerns - Where should my child be upon exiting Head Start / Preschool? - What is the teacher’s expectations for my child? - What will the teacher do to help my child reach / exceed these expectations? - What can I do? 2. Checkpoint - Is my child making adequate progress? If not, what will my child’s teacher do to ensure he or she does? - What can I do? 3. Final “Assessment” - Where is my child now? - How can I better prepare them for kindergarten?

17
Evaluating - Program - School - Individual classrooms It’s confidential, so it’s perfect for sharing with district, state, etc. Professional Development Opportunities – What additional support can be given…

18
1. What Standards / Measures do you want included in the report? 2. Which student(s) / class? 3. Want to filter by any specific demographic(s)? 4. Pick Checkpoint Period. 5. Format Sharing examples Ideas…
 / class. 3. Want to filter by any specific demographic(s). 4. Pick Checkpoint Period. 5. Format Sharing examples Ideas….")
20
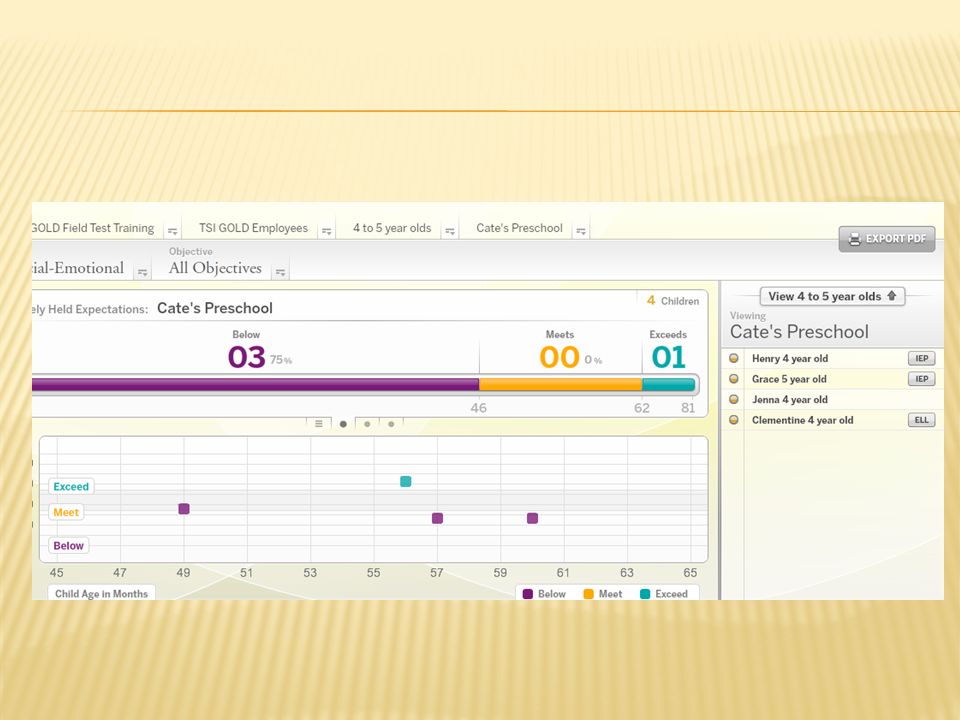
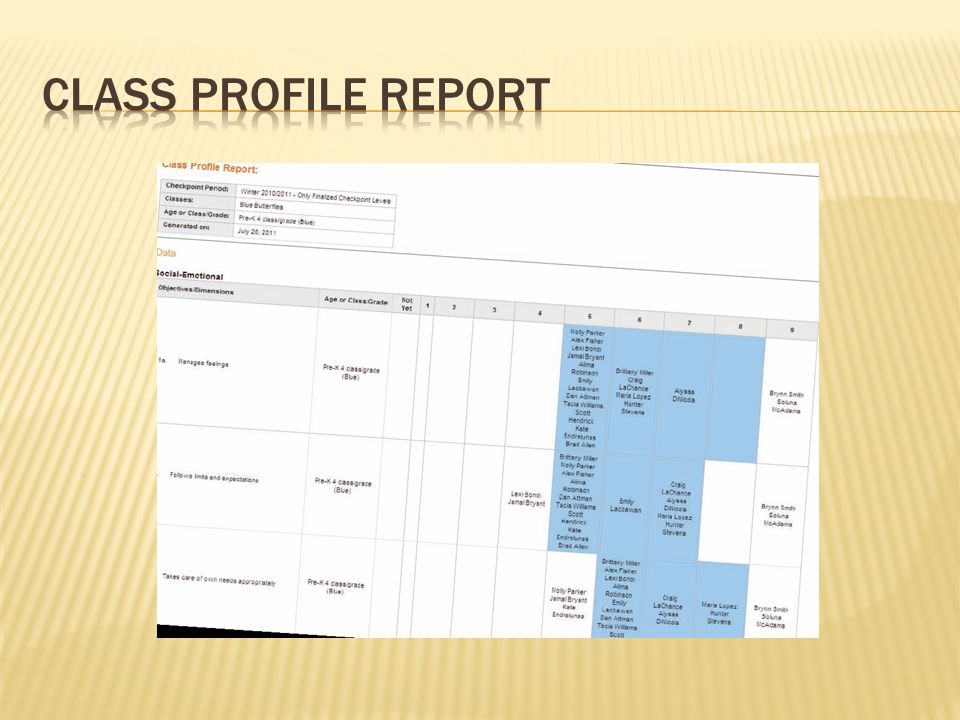
The Class Profile Report is available in English and Spanish, compares information about the knowledge, skills, and behaviors of the children in one or more classes with the widely held expectations of their age or class/grade. This information can be compared for each dimension during one checkpoint period.

21
The “Class Profile Report” can be run on multiple classes at one, enabling administrators to get an overview of where all children are, or on a specific class, making the report more useful for daily planning. Teachers using the report can do so at any time during the checkpoint period, using preliminary levels, in order to understand where children are at that time.

22
In this information can then be compared with the information from the end of the previous checkpoint, helping teachers plan for the rest of the checkpoint period based upon growth.

23
Because the “Class Profile Report” shows teachers where the children in their classes are along each progression, teachers can utilize the color bands that appear on the report to easily plan small group activities for children that are below, meeting, or exceeding the widely held expectations.

24
For example, if a group of three children appear just below their widely held expectations, they could be grouped with one child who is well into the color band, allowing for modeling to take place within the group activity. This report also lets teachers consider how they might form a mixed ability group so children can learn form each other.

26
When you would like to run the class profile report, you will need to select the following: Go to “report” tab Go down to “class profile” *Select Class *Select Class level *Select Check Point Season *Select Output – Will be HTML

27
HTML will allow your to view on your computer screen. The class profile recommends that you use the PDF to print out the report. The PDF will keep the breaks in the proper spot when printing report.

28
Select “Generate Report” The report will only print the children that you have selected earlier. This screen will be your Class Profile Report.

29
This report will sort all children by Dimension and class level. Green color bands will be 3 to 4 year old level. This report will show all levels of developments.

30
The check point data will be completed for viewing and/or printing

31
This report let’s teachers and administrators see how individual children are progressing over multiple checkpoint periods. This report helps teachers plan for each individual child and easily identify areas where he or she may need additional support

32
This report can be generated at any time using finalized data from previous checkpoints or preliminary levels to plan based on growth. This report can be used as a final report to show where the child started and where he or she finished for each dimension.

34
Documentation Forms: Alphabet, Numbers and Shapes There are four forms that you can use to help document a child’s skills and achievements in specific areas. Each form is related to one or more dimensions. The dimensions are listed at the top of each form

35
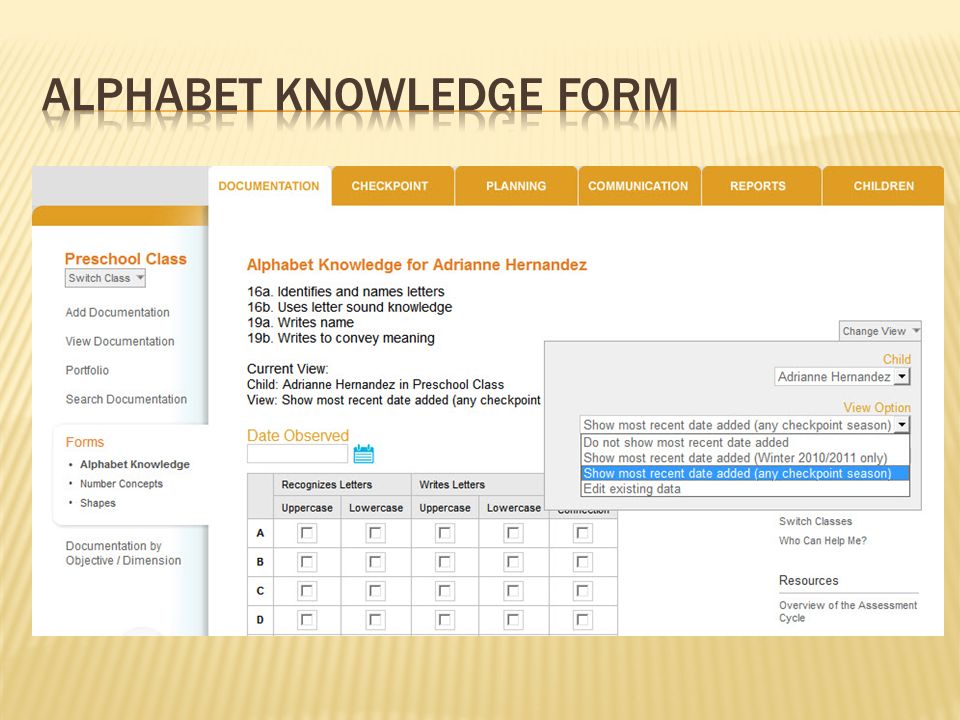
Relates to the following dimensions: 16a. Identifies and names letters 16b. Uses letter sound knowledge 19a. Writes name 19b. Writes to convey meaning On the form, check the box next to the letters the child recognizes, writes and can make letter–sound association.

37
Relates to the following dimension: 21b. Understands shapes On the form, check the box next to the shapes the child can identify and describe correctly. NOTE: When you are on the Add Documentation screen, and select one of the objectives tied to any of these forms, an icon for ABC, Numbers, or Shapes will appear. You can click the icon to fill out the form. Entries filled out from the Add Documentation screen will show in the Forms screens

38
Relates to the following dimension: 20c. Connects numerals with their quantities On the form, check the box next to the numerals the child identifies and connects to a quantity correctly

39
Use the forms online at each computer station.

41
www.teachingstrategies.com www.teachingstrategies.com Video link for widely held expectations report: https://www.teachingstrategies.com/gold/help /popup.cfm?itemID=158&ut=1&langID=1

Similar presentations


 is a small-group, supplementary literacy intervention designed.>")


