Download presentation
Presentation is loading. Please wait.

1
Hurricanes

2
Definition A tropical cyclone with sustained one-minute winds of at least 74 mph (64 knots), at an elevation of 10 meters. Derived from the Spanish word "huracan" , which was most likely inspired by Hunraken, the name for the ancient Mayan storm god or Hurakan, the Quiche god of thunder

3
Hurricane Facts They are tropical cyclones (low pressure areas) with sustained winds at least 64 knots (74 mph). Strongest hurricane on record (Camille) had winds exceeding 200 mph. Typically km in diameter (smaller than midlatitude cyclones). Can be associated with heavy rains (10-20 inches!), tornadoes, and storm surges on the coast. Also called typhoons and tropical cyclones
 with sustained winds at least 64 knots (74 mph). Strongest hurricane on record (Camille) had winds exceeding 200 mph. Typically km in diameter (smaller than midlatitude cyclones). Can be associated with heavy rains (10-20 inches!), tornadoes, and storm surges on the coast. Also called typhoons and tropical cyclones.")
5
Katrina 1833 deaths 125 billion in damage
Most destructive hurricane in U.S. history

7
Figure 11.24: Flood waters inundate New Orleans, Louisiana, during August, 2005, after the winds and storm surge from Hurricane Katrina caused several levee breaks. Fig , p. 320

8
1900 Galveston, TX Hurricane: The Greatest Loss of Life of Any U. S
1900 Galveston, TX Hurricane: The Greatest Loss of Life of Any U.S. Meteorological Event (8000 died)
")
10
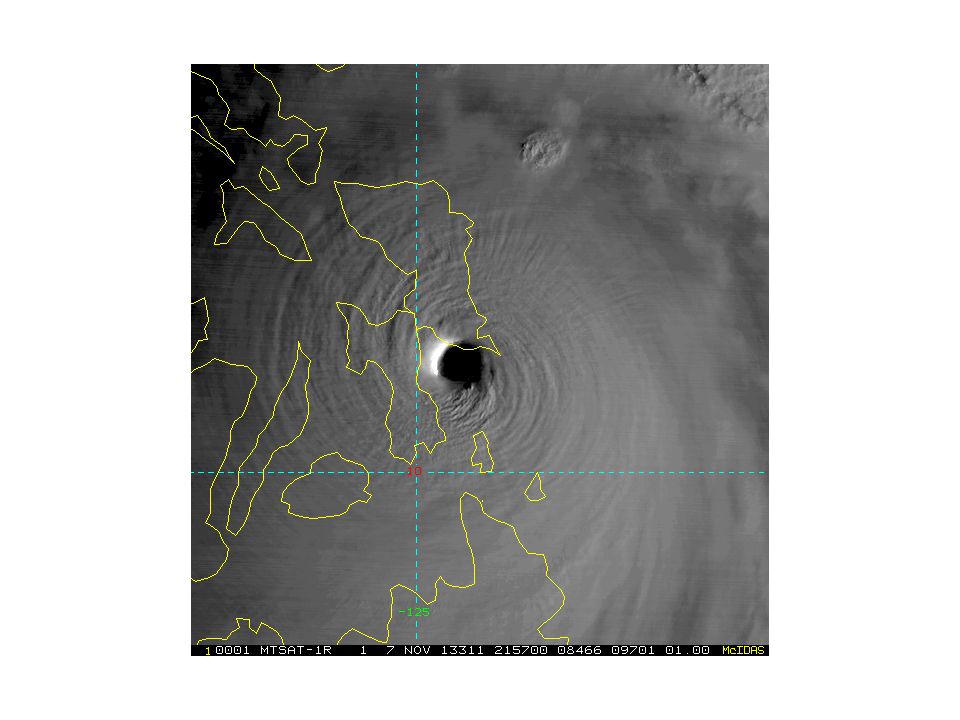
Typhoon Haiyan

13
Not on the equator! Fig. 11-10, p. 307
Figure 11.10: Regions where tropical storms form (red shading), the names given to storms, and the typical paths they take (red arrows). Not on the equator! Fig , p. 307
, the names given to storms, and the typical paths they take (red arrows). Not on the equator! Fig , p")
14
Saffir-Simpson Hurricane Category
Table 11-2, p. 313

15
Figure 11.16: The number of hurricanes (by each category) that made landfall along the coastline of the United States from 1900 through All of the hurricanes struck the Gulf or Atlantic coasts. Categories 3, 4, and 5 are considered major hurricanes. Fig , p. 313

16
Experience a hurricane

17
Atlantic Basin Hurricanes and Tropical Storms
Figure 11.7: The total number of hurricanes and tropical storms (red shade) and hurricanes only (yellow shade) that have formed during the past 100 years in the Atlantic Basin—the Atlantic Ocean, the Caribbean Sea, and the Gulf of Mexico. Atlantic Basin Hurricanes and Tropical Storms
 and hurricanes only (yellow shade) that have formed during the past 100 years in the Atlantic Basin—the Atlantic Ocean, the Caribbean Sea, and the Gulf of Mexico. Atlantic Basin Hurricanes and Tropical Storms.")
18
Hurricane Structure

19
Major Features: Eye (nearly clear) Eye Wall Rainband Spiral Rainbands
Figure 11.20: Visible satellite image of Hurricane Ivan as it makes landfall near Gulf Shores, Alabama, on September 15, Ivan is a major hurricane with winds of 105 knots (121 mi/hr) and a surface air pressure of 945 mb (27.91 in). Fig , p. 317
 and a surface air pressure of 945 mb (27.91 in). Fig , p")
22
Figure 11.18: Color radar image of Hurricane Andrew as it moves on shore over south Florida on the morning of August 24, The National Hurricane Center (NHC) is located about 30 km (19 mi) from the center of the eye. Fig , p. 316

24
Figure 11. 8: The top diagram shows an intensifying tropical cyclone
Figure 11.8: The top diagram shows an intensifying tropical cyclone. As latent heat is released inside the clouds, the warming of the air aloft creates an area of high pressure, which induces air to move outward, away from the high. The warming of the air lowers the air density, which in turn lowers the surface air pressure. As surface winds rush in toward the surface low, they extract sensible heat, latent heat, and moisture from the warm ocean. As the warm, moist air flows in toward the center of the storm, it is swept upward into the clouds of the eyewall. As warming continues, surface pressure lowers even more, the storm intensifies, and the winds blow even faster. This situation increases the transfer of heat and moisture from the ocean surface. The middle diagram illustrates how the air pressure drops rapidly as you approach the eye of the storm. The lower diagram shows how surface winds normally reach maximum strength in the region of the eyewall. Fig. 11-8, p. 305

25
Eye slopes outward

26
In much the same way an ice skater spins more quickly as her arms are tucked close into her body, a hurricane also spins at a faster pace near the center than near the outer edge.

27
Destruction most intense on right side of cyclone (wind + storm speed)
27

28
Eye wall replacement A shrinking eye indicates storm intensification.
Some intense hurricanes develop double eye walls, as rain bands contract and intensify. Eye wall replacement leads to weakening of the hurricane winds, followed by renewed strengthening.

30
The Greatest Damage and Loss of Life from Hurricanes is Near the Coast Associated with Storm Surges

33
Figure 11.15: The changing of the ocean level as different category hurricanes make landfall along the coast. Notice that the water typically rises about 4 feet with a Category 1 hurricane, but may rise to 22 feet (or more) with a Category 5 storm. Fig , p. 312

34
Before and after Hurricane Iva, Sept 2004, coastal Alabama
Figure 11.21: Beach homes along the Gulf coast at Orange Beach, Alabama (a) before, and (b) after Hurricane Ivan made landfall during September, (Red arrows are for reference.) Before and after Hurricane Iva, Sept 2004, coastal Alabama
 before, and (b) after Hurricane Ivan made landfall during September, (Red arrows are for reference.) Before and after Hurricane Iva, Sept 2004, coastal Alabama.")
35
Before a hurricane… After a hurricane.

36
Storm Surge Video

37
What is the energy source of Hurricanes?

38
Hurricanes Hurricanes get their energy from the warm, waters of the tropics. Require the water surface to be at least 80F Also need moist air through depth and weak wind shear. Generally develop as a weak tropical disturbance moves over the oceans.

39
Revving Up a Hurricanes: Two Positive Feedbacks Involving Warm Water
Convergence-Convection (CISK—Conditional Instability of the Second Kind) Surface flux-Convection (WISHE—Wind Induced Surface Heat Exchange)
 Surface flux-Convection (WISHE—Wind Induced Surface Heat Exchange)")
40
Hurricane Origin

41
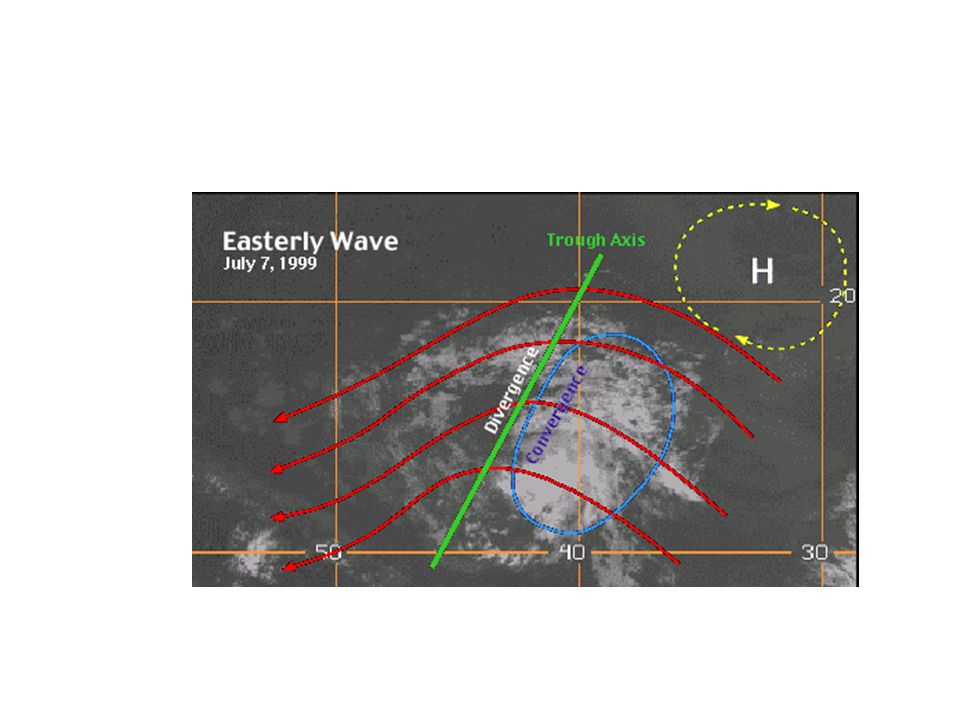
Many Atlantic Hurricanes Begin as Tropical Waves Over Africa

45
Hurricane Prediction: A Mixed Report
During the past thirty years there has been a substantial improvement in hurricane track forecasts as computer models improved and more data became available to describe their environment. Over the same period only minimal improvement is hurricane intensity forecasts.

48
Katrina 48-h Before: Virtually a Perfect Forecast of Track

50
NOAA P3 “Hurricane Hunter” Aircraft

52
Gulfstream IV-SP (G-IV) is a high altitude, high speed, twin turbofan jet aircraft
 is a high altitude, high speed, twin turbofan jet aircraft")
53
Substantial Promise The use of higher resolution prediction and better data around and in hurricanes should result in better intensity predictions. 15-km grid spacing 1.67 km grid spacing

54
U.S Hurricane Headquarters

Similar presentations


>")


 and the Tropic of Capricorn (23.5S) The weather is very different.>")
 fuel (latent.>")


