Download presentation
Presentation is loading. Please wait.

1
Data visualization

2
Numbers are boring

6
Data tells a story

7
Unemployment in the US 2009

8
The art of data

12
Your data

13
Label your axis!

15
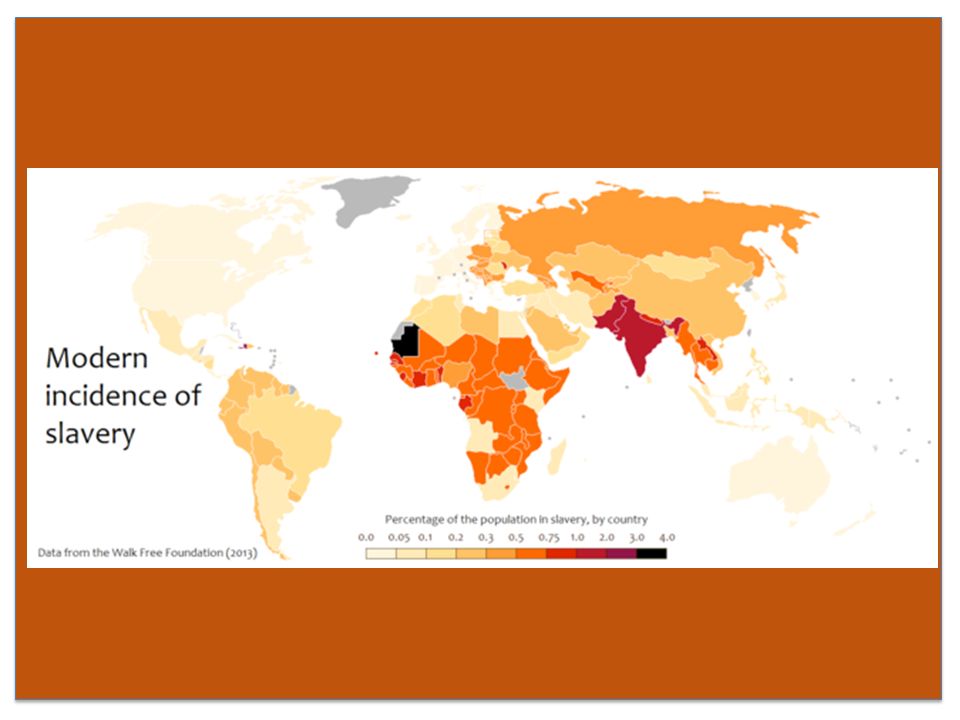
Cite the source of your data

16
Keep your colors plain

17
Make sure you have units

18
Spell check

19
Don’t add random graphics

20
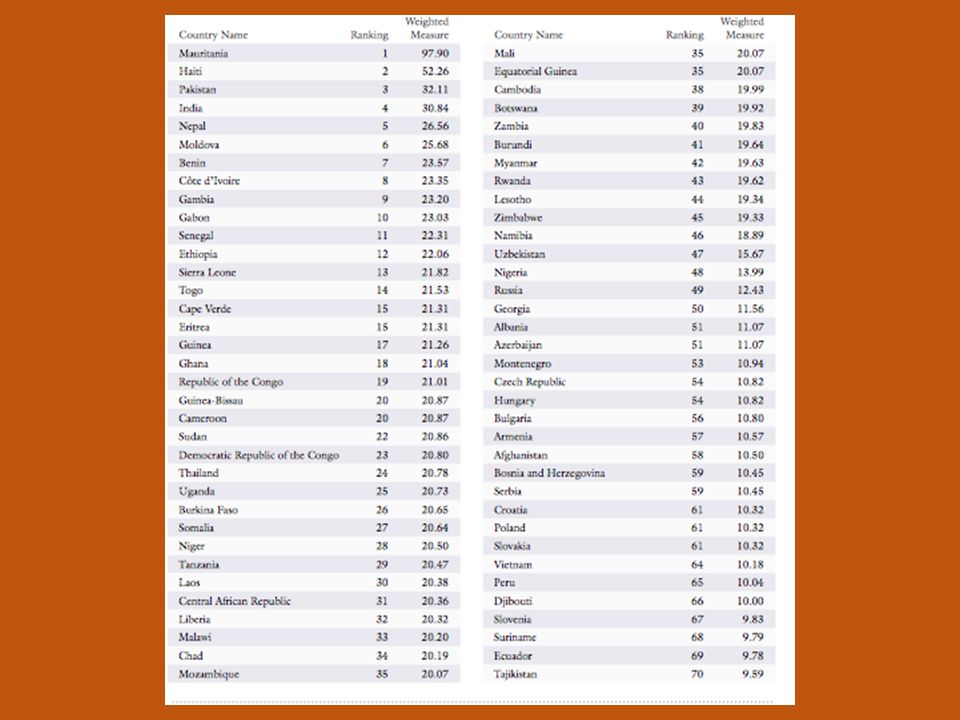
Organize your data

21
Rules for your graph Label your axis Cite the source of your data Make sure you have units Keep the colors under control Spell check Don’t add random graphics Organize your data

22
Which type of graph?

23
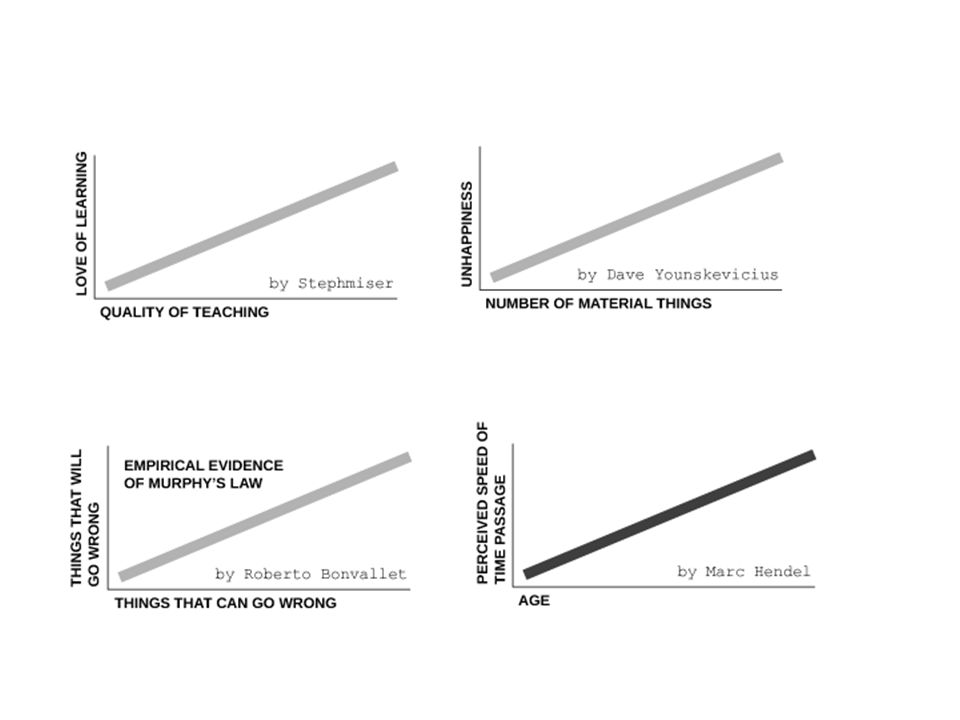
X-Y Plot The relationship between two different things Both increase over time = positive relationship Both decrease over time = negative relationship

24
Y Axis X Axis Y Axis X Axis Positive relationship Negative relationship

26
Line graph Tracks changes over time Useful for tracking many small changes

27
Approval ratings of George W Bush 2001 - 2006 Date Percent

28
Area graph Based on the line graph Track changes over time of two or more related groups The different areas are cumulative

29
Number of slaves in the American South 1680-1860 slaves year

30
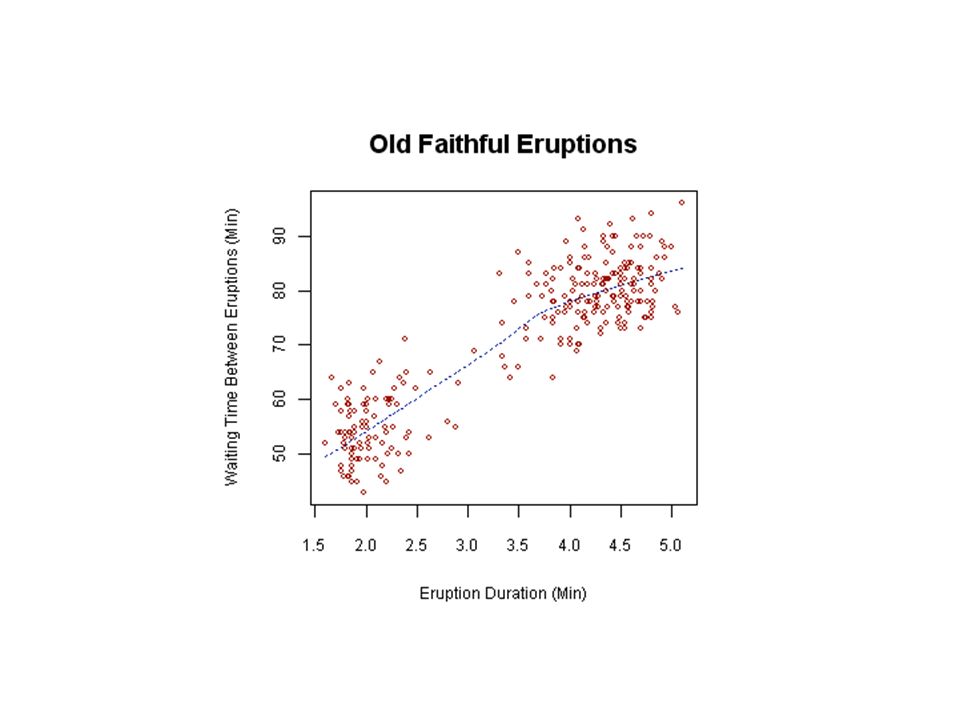
Scatter plot Works well with many data points Especially if these data points are not evenly spaced

32
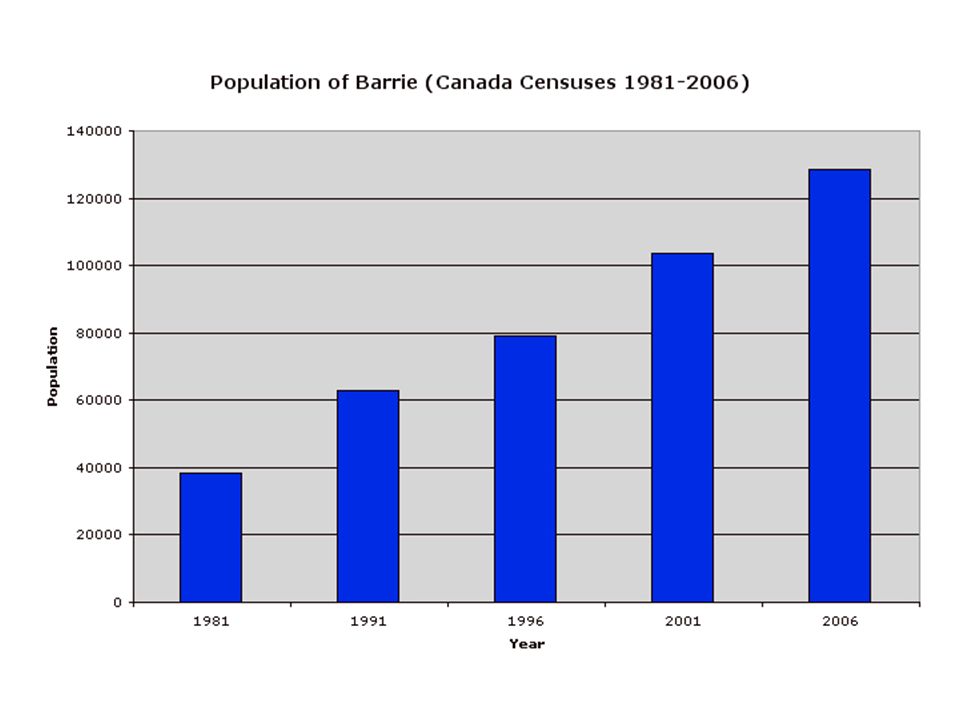
Bar graph Compares different groups Compares changes over time (fewer changes with large differences) Categories on X Frequency on Y
 Categories on X Frequency on Y")
34
Histogram vs bar graph Histograms use continuous data Instead of categories, uses ranges (because of this, histograms usually don’t have spaces between the bars)
")
36
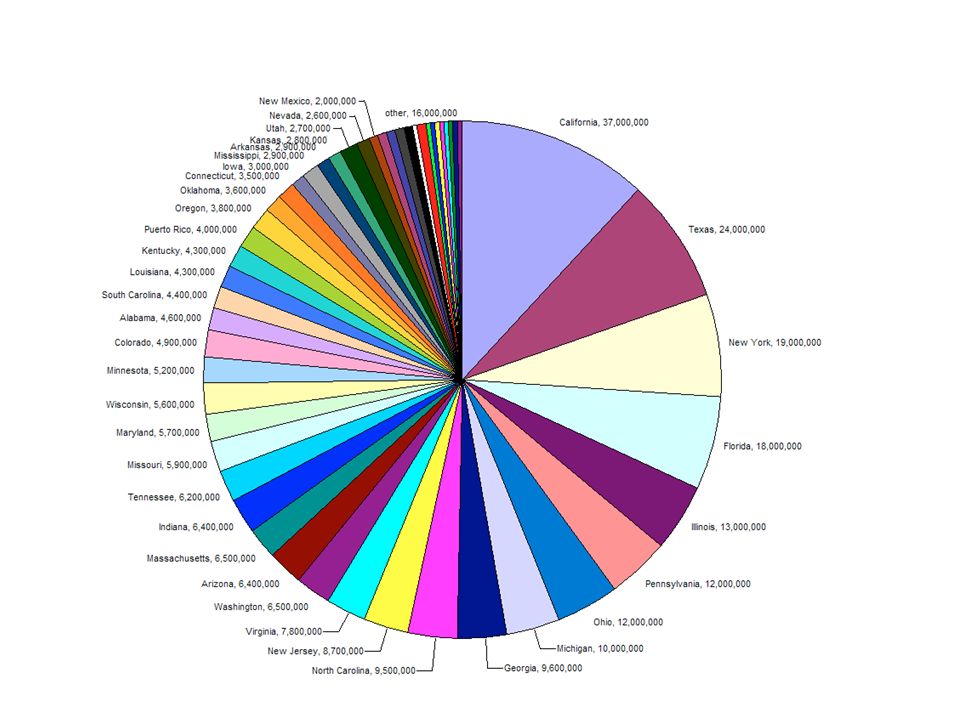
Pie chart Do not show changes over time Parts of a whole Make sure the slices add up to 100%!

39
How to lie with your graph

40
Truncated graphs

41
Fiddle with the y axis

42
Play with graph dimensions

43
The perils of 3D 1.3.2. 4.

44
Remember, numbers can lie.

45
Your assignment

Similar presentations