Download presentation
Presentation is loading. Please wait.

1
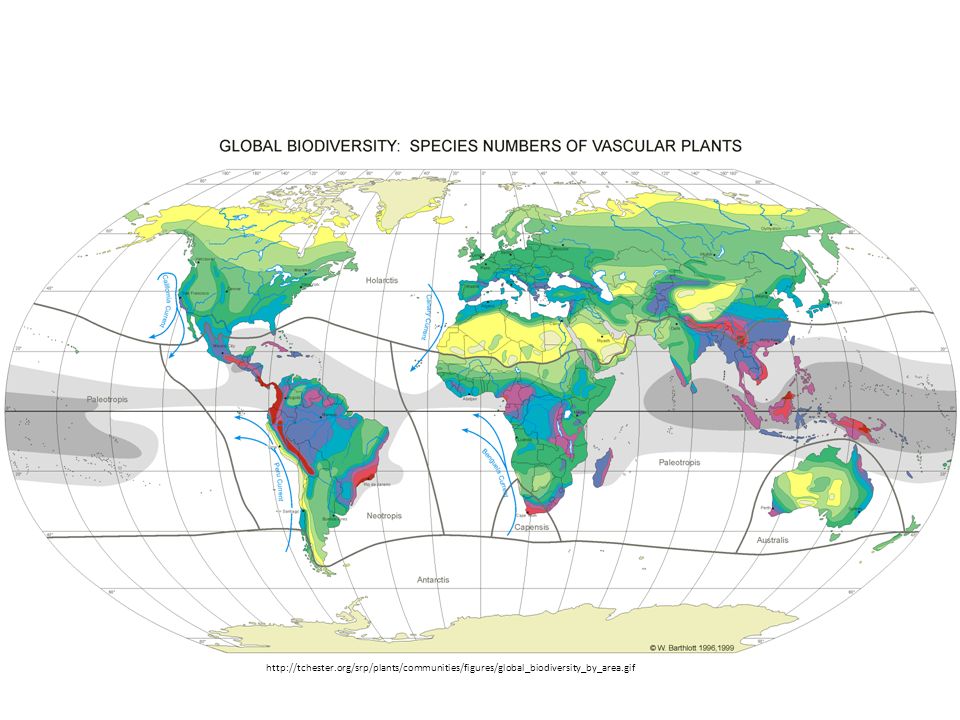
Macroecology & uneven distributions of wealth Ken Locey

2
http://tchester.org/srp/plants/communities/figures/global_biodiversity_by_area.gif
3
183,913,348 records of birds in the Global Biodiversity Information Facility database

4
Abundance: n i /N Distribution: f(k;λ) = λ k e -λ /k! Diversity: H’ = -Σp i *ln(p i ) …study of ecological relationships that involves characterizing and explaining statistical patterns of… Macroecology
 …study of ecological relationships that involves characterizing and explaining statistical patterns of… Macroecology.")
5
Land birds Land mammals Geographic range patterns North-South (km) East-West (km) 100 1,000 10,000
 East-West (km) 100 1,000 10,000")
6
Metabolic Theory of Ecology (MTE) Ecological phenomenon ∝ M 3/4 e -E/kt Temp. corrected max. rate of whole organism biomass production Slope = 0.76 R 2 = 0.99

7
Species Abundance Distribution Abundance Class frequency (frequency distribution)
")
8
http://encyclopediaurantia.org/images/ROM11.JPG

10
DATA

11
Computing GIS Math & Stats Metabolic rate ∝ M 3/4 e -E/kt Information: Tools

12
COLLABORATION & SHARING Code development Sharing Source networks

13
GIS Programming Published Research Data management Math & Stats Collaboration Undergraduate & Graduate research Skills Jobs Grad School

15
Center for Macroecology, Evolution, & Climate www.macroecology.ca macroecology.ku.dk whitelab.weecology.org

18
Species Abundance Distribution Abundance Class frequency (frequency distribution)
")
19
Species Abundance Distribution Rank in Abundance Abundance (Rank-abundance distribution)
")
20
Wheat Production (tons) tons 62.9 104588178.7
 tons")
21
Poverty in Rural America, 2008 Percent in Poverty 54.5 - 2525 - 2020 – 14.314.2 – 12.212.1 - 1010 – 3.1

23
Distributions of Wealth (DOW) Supreme importance attaches to one economic problem, that of the distribution of wealth. Is there a natural law according to which the wealth of society is divided? – John Bates Clark Wealth: sources of human welfare which are material, transferable, and limited in quantity.

24
Total quantity ( Q) Community abundance Global Oil Consumption GDP, GNP Number of entities ( N) Species Nations Economic classes Distributions of Wealth (DOW)
 Community abundance Global Oil Consumption GDP, GNP Number of entities ( N) Species Nations Economic classes Distributions of Wealth (DOW)")
25
If Q = 10 and N = 3, then: 8 unordered ways to sum N positive integers to obtain Q 8+1+1 7+2+1 6+3+1 6+2+2 5+4+1 5+3+2 4+4+2 4+3+3 Distributions of Wealth (DOW)
")
26
Do we observe the average of possible DOWs?

27
The feasible set (all possible shapes of the DOW) 16,958 shapes for Q = 50 & N = 10 Rank Wealth
 16,958 shapes for Q = 50 & N = 10 Rank Wealth")
28
Combinatorial Explosion QNSize of feasible set 501016,928 500102.013 × 10 12 5000101.531 × 10 21

29
Heat mapping the feasible set (or a random sample) ln(wealth) Rank Q=1,000 N=80
 ln(wealth) Rank Q=1,000 N=80")
30
Heat mapping the feasible set (or a random sample) ln(abundance) Rank in abundance ca. 4.02x10 29 possible shapes for N=1000 & S=80

31
Q = Total community abundance ( i.e. number of individuals) N = Species richness (i.e. number of species) Ecological DOWs (species-abundance distributions)
 Ecological DOWs (species-abundance distributions).")
32
Observed wealth 10 0 10 1 10 2 Predicted wealth 10 2 10 1 10 0 R 2 per site OBSERVED: [1, 2, 10, 12, 20, 30, 40, 60, 110] PREDICTED: [1, 2, 11, 11, 22, 28, 43, 50, 117] R 2 = 0.99
![Observed wealth Predicted wealth R 2 per site OBSERVED: [1, 2, 10, 12, 20, 30, 40, 60, 110] PREDICTED: [1, 2, 11, 11, 22, 28, 43, 50, 117] R 2 = 0.99](http://images.slideplayer.com/27/9019212/slides/slide_32.jpg "Observed wealth Predicted wealth R 2 per site OBSERVED: [1, 2, 10, 12, 20, 30, 40, 60, 110] PREDICTED: [1, 2, 11, 11, 22, 28, 43, 50, 117] R 2 = 0.99")
33
Observed abundance 10 0 10 1 10 2 Predicted abundance 10 2 10 1 10 0 R 2 per site R 2 = 0.99 R 2 = 0.89 R 2 = 0.80 R 2 = 0.75

34
Observed abundance 10 0 10 1 10 2 Predicted abundance 10 2 10 1 10 0 R 2 per site R 2 = 0.99 R 2 = 0.89 R 2 = 0.80 R 2 = 0.75 R 2 per site 0.0 1.0

35
Observed abundance 10 0 10 1 10 2 Predicted abundance 10 2 10 1 10 0 R 2 per site 0.0 1.0 R 2 = 0.93

36
Food & Agriculture Organization of the UN US Dept of Energy, Energy Information Admin.

37
0.830.910.93 Predicted supply Observed supply Food supply among nations (1960-2010) grams/capita/day * 0.1tons * 0.0001grams/capita/day
 grams/capita/day * 0.1tons * grams/capita/day")
38
0.690.770.91 Predicted pop. size Observed pop. size Population sizes among nations (1960-2009, millions of people)
.")
39
0.880.92 Predicted Observed Oil use among nations (1980-2009, barrels per day * 0.01)
")
40
Predicted home runs Observed home runs 0.930.880.90 0.91 0.89 0.940.93 (2002-2010) http://mlb.mlb.com
")
41
Are DOWs similar to the average of possible shapes? …very often Do Q and N constrain the DOW more than ever realized? …Yup Is the feasible set good for more than predictions? …Absolutely Is combinatorial explosion a pain in the *expletive*? …Not for long…?

42
Funding USU College of Science – Willard L. Eccles Fellowship NSF CAREER award to Ethan White Research grant from Amazon Web Services

43
Acknowledgments Individuals, agencies, organizations responsible for the collection and management of the: – Breeding Bird Survey, Christmas Bird Count, Forest Inventory and Analysis, Mammal Community Database, North American Butterfly Association, Argonne National Laboratory’s MG-RAST metagenomic server Colleagues & Collaborators – USU: Ethan White, Xiao Xiao, Dan McGlinn – Berkeley Harte Lab: Justin Kitzes – SESYNC: Bill Burnside UCO college of Math and Science

44
The feasible set as a framework Understanding Comparing Inequality

45
Percentile of the feasible set Gini’s coefficient of inequality

46
The feasible set (all possible values of species evenness) Species evenness Species richness, S Total abundance, N = 60
 Species evenness Species richness, S Total abundance, N = 60")
47
Combinatorial Explosion QNSize of feasible set 100010886,745,696,653,253 1000100 302,194,941,264,401,427,042,462,944,147 1000900190,569,292

48
Feasible sets are dominated by hollow-curves Q=50, N=20 Q=50, N=10 Evenness (Smith & Wilson, 1996)
")
49
MTE prediction: species richness decreases with temperature (S ∝ Ae -E a /kT ) Computer Science Student: Biology student: Chemistry Student models based on chemical kinetics/activation energy microbe data, reasons why MTE should (not) work for microbes model development data scraping & management Temperature-richness predictions of MTE do not hold for diverse microbe communities as tested using several models of chemical kinetics. This may be explained by microbial dormancy and dispersal. + Conclusion(?)
.")
50
Body mass (g) Land birdsLand mammals Body-size distributions Number of species continental regional patch
 Land birdsLand mammals Body-size distributions Number of species continental regional patch")
Similar presentations


 Focuses on research of the coupled dynamics of social- ecological systems (SES) and the translation of.>")

 Section 2 Energy Flow (pp. 67 –>")


![Today’s Agenda Review Homework #1 [not posted]](/16/5108889/big_thumb.jpg "Today’s Agenda Review Homework #1 [not posted]>")


 Species richness, i.e. number of species present 1) Species.>")
