Download presentation
Presentation is loading. Please wait.

1
Methods for Dummies Overview and Introduction
4th November 2015 Isobel Weinberg and Taposhri Ganguly

2
PROS CONS Relaxed environment Presentation skills
Networking/knowing who to ask No assessment involved Fun at the FIL Know-how/practical guide Presenting with partner Learning Specific/deep understanding Overall view

3
Overview What is MfD? Programme How to prepare your presentation
Where to find information and help Experts SPM

4
Welcome Aim of MfD: to provide a basic introduction to human brain imaging analysis methods, focusing on fMRI and M/EEG Wednesdays hrs in 4th floor seminar room Each talk will be given by two presenters and last about 30 min + 15 minutes for questions. Generally it should introduce the relevant theory and be followed by a demo using SPM12 interface. Term 1: fMRI Term 2: MEG and EEG

5
Schedule – 1 Introduction to MfD 4/11/2015 Basis of the BOLD signal
11/11/2015 Samira Kazan Preprocessing: realigning and unwarping 18/11/2015 Ged Ridgway Preprocessing: coregistration and spatial normalization 25/11/2015 T-tests, Anovas and Regression 2/12/2015 TBC 1st level analysis: design matrix, contrasts and inference, GLM 9/12/2015 Guillaume Flandin 1st level analysis: basis functions, parametric modulation and correlated regressors 16/12/2015 2nd level analysis: between-subject analysis 13/01/2015

6
Term 2 topics 2nd level analysis: between-subject analysis Bayes for Beginners Random Field Theory Study design and efficiency Issues with analysis and interpretation (e.g. double dipping, Type I/Type II errors) Basis of the M/EEG signal Preprocessing and experimental design Contrasts, inference and source localisation Introduction to connectivity (PPI, resting state) DCM for fMRI: theory and practice DCM for ERP/ERF: theory and practice Model comparison Voxel-based morphometry Diffusion tensor imaging
 Basis of the M/EEG signal. Preprocessing and experimental design. Contrasts, inference and source localisation. Introduction to connectivity (PPI, resting state) DCM for fMRI: theory and practice. DCM for ERP/ERF: theory and practice. Model comparison. Voxel-based morphometry. Diffusion tensor imaging.")
7
How to prepare Read the Presenter’s Guide Remember your audience are not experts… Don’t just copy last year’s slides

8
Where to find information
MfD homepage: Programme Resources: Presenter’s guide, previous slides, links, SPM manual etc Name of expert ( in UCL Outlook or from typing name + “FIL” or “UCL” into Google)
")
9
Where to find information
Go to the MfD homepage Resources Online Key papers Previous years’ slides Human Brain Function Textbook (online) SPM course slides Cambridge CBU homepage (Rik Henson’s slides) Local Methods Group Experts Monday Methods Meetings (4th floor FIL, 12.30) SPM list
 SPM course slides. Cambridge CBU homepage (Rik Henson’s slides) Local. Methods Group Experts. Monday Methods Meetings (4th floor FIL, 12.30) SPM list.")
10
Where to find help: Experts
Samira Kazan Gabriel Ziegler Will Penny John Ashburner Gareth Barnes Mohamed Seghier Tom FitzGerald Guillaume Flandin Sarah Gregory Vladimir Litvak Bernadette van Wijk Dimitris Pinotsis Peter Smittenaar the expert: discuss presentation and other issues (1 week before talk) Expert will be present in the session
 Expert will be present in the session.")
11
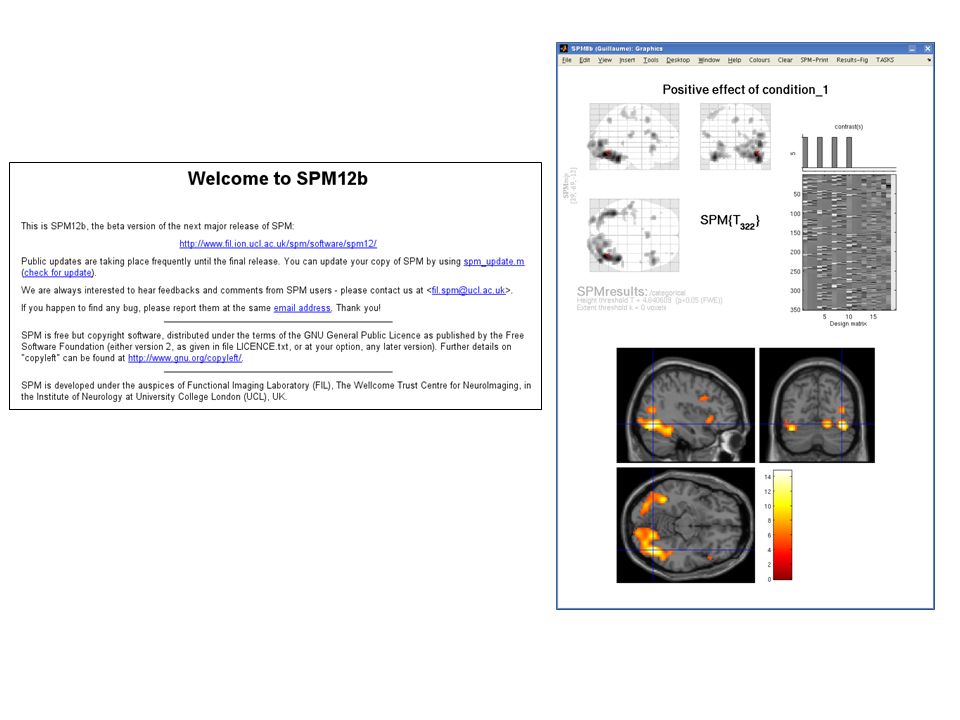
SPM Statistical Parametric Mapping Invented at the FIL
A software package designed for the analysis of brain imaging data in fMRI, PET, SPECT, EEG & MEG It runs in Matlab… just type SPM at the prompt and all will be revealed The SPM website has a manual and datasets available for playing around with

12
What does SPM and MfD do? Using neuroimaging, the idea behind SPM is to identify and make inferences about regionally specific brain activity. This gives way for analysing the integration and interactions among the engaged and identified regions. MfD helps to provide the background to understand the principles of experimental design and data analysis implemented in SPM

14
What does SPM do? Allows you to do: preprocessing data analysis:
connectivity general linear model parameter estimation dynamic causal modeling

15
SPM overview GLM describes the data at each voxel: mass univariate approach Takes into account Experimental and confounding effects… and residual variability GLM used in combination with a temporal convolution model Once you have carried out your pre-processing you can specify your design and data The design matrix is simply a mathematical description of your experiment E.g. ‘visual stimulus on = 1’ ‘visual stimulus off = 0’

16
Preprocessing is the preparation of your imaging data to start your analysis Do motion correction (realignment of the data), normalise so that it’s all in the same space, smooth the data so that you can compare between subjects.
, normalise so that it’s all in the same space, smooth the data so that you can compare between subjects.")
17
Once you have carried out your pre-processing you can specify your design and data The design matrix is simply a mathematical description of your experiment E.g. ‘visual stimulus on = 1’ ‘visual stimulus off = 0’

18
GLM describes the data at each voxel: mass univariate approach It takes into account experimental and confounding effects and residual variability

19
Then you estimate how much your parameters of interest explain the BOLD response for each voxel, and threshold the resulting estimates to find out where your parameters explain significant amounts of variance.

20
X y + = Mass-univariate analysis: voxel-wise GLM
Model is specified by Design matrix X Assumptions about e N: number of scans p: number of regressors The design matrix embodies all available knowledge about experimentally controlled factors and potential confounds.

21
Thank you Please don’t leave without having cake

Similar presentations


 Methods & models for fMRI data analysis in neuroeconomics November 2010 Klaas Enno Stephan Laboratory for Social & Neural.>")
>")


