Download presentation
Presentation is loading. Please wait.

1
High Voltage Test System Results, 03-04/07 J. Long, Indiana University System Overview and Modifications Readout system Breakdown tests of acrylic System performance away from breakdown Direct monitoring of resting current

2
stainless can aluminum plate wire seal flange G-10 standoff HV plunger control rod Indium seal ceramic standoff HV electrodeground electrode ground control rod Vacuum-LHe HV feedthrough bearings bellows 0.53 m quartz window High voltage system prototype at LANL Vacuum chamber Supply cryostat HV feedthrough Actuator Test proposed amplification method Measure breakdown properties of large volumes of LHe Existing data: 150 kV/cm at 4 K, 1cm gap LHe bath pumping line

3
Previous results from prototype system Maximum leakage currents under these conditions (95% C. L.) : SF (2.07 K): 733 pA Normal State (3.98 K): 169 pA Short-duration breakdown not affected by neutron radiation (10 6 /s, ~MeV) Small commercial HV feedthrough exceeded maximum rating in air (40 kV) by 25% when immersed in SF Maximum potentials sustained: 11.8 liters Normal State (4.38 K), 7.2 cm gap: (96 ± 7) kV/cm 12.8 liters SF at 2.14 K, 7.8 cm gap: (31 ± 3) kV/cm Possible further degradation below 1.9 K Bubble formation (common breakdown culprit) observed when charging above 10 kV, likely coincident with noise
 : SF (2.07 K): 733 pA Normal State (3.98 K): 169 pA Short-duration breakdown not affected by neutron radiation (10 6 /s, ~MeV) Small commercial HV feedthrough exceeded maximum rating in air (40 kV) by 25% when immersed in SF Maximum potentials sustained: 11.8 liters Normal State (4.38 K), 7.2 cm gap: (96 ± 7) kV/cm 12.8 liters SF at 2.14 K, 7.8 cm gap: (31 ± 3) kV/cm Possible further degradation below 1.9 K Bubble formation (common breakdown culprit) observed when charging above 10 kV, likely coincident with noise.")
4
HV System – Previous modifications 2005-2006: “Common sense” improvements Polished electrodes, plasma discharge cleaner (for Hydrocarbons), dry pumps only, LN2 traps on pumps, pre-cool with cold He gas, basic LHe filtering, attempt electrode conditioning Results: no improvement (pitting, contamination, mechanical failure, discharges behind HV electrode)
, dry pumps only, LN2 traps on pumps, pre-cool with cold He gas, basic LHe filtering, attempt electrode conditioning Results: no improvement (pitting, contamination, mechanical failure, discharges behind HV electrode)")
5
Acrylic Breakdown Tests Replaced ceramic standoffs behind HV electrode with acrylic Advantages Poor match of actual perimeter of reference cell design Reference cell perimeter = 2 (50 cm + 10 cm) = 120 cm Total perimeter of standoffs = 44 cm More expensive than slab between electrodes (?) Disadvantages Hollow construction possible Leakage current monitoring comparable to baseline (ceramic) Avoids problems associated with holding objects between electrodes Strong fields (60 kV/cm) available at gaps comparable to reference gap Mimic electrode recesses without modifying electrodes Field behind HV electrode less uniform
 = 120 cm Total perimeter of standoffs = 44 cm More expensive than slab between electrodes ( ) Disadvantages Hollow construction possible Leakage current monitoring comparable to baseline (ceramic) Avoids problems associated with holding objects between electrodes Strong fields (60 kV/cm) available at gaps comparable to reference gap Mimic electrode recesses without modifying electrodes Field behind HV electrode less uniform")
6
Modified Standoff Design for Acrylic Breakdown Tests 6” long, 2” diameter acrylic tube replaces ceramic Steel end pieces same dimensions as on ceramic, mimic recesses John Ramsey, LANL

7
Modified Standoff Design for Acrylic Breakdown Tests Spring-loaded retaining ring holds acrylic annulus in place against slipping from thermal contraction John Ramsey, LANL

8
Condition of HV electrode – 12/06 and 02/07 runs Fill-holes and scratches http://www.jlab.org/~tajima/edm/EDM_HV.html Shim with sharp edges

9
Installation of acrylic – 04/07 runs http://www.jlab.org/~tajima/edm/EDM_HV.html Holes patched and polished (insulators have through-holes) No shims necessary
 No shims necessary")
10
Capacitances Relevant to Voltage, Currents

11
C HG C HC C HP Capacitances Relevant to Voltage, Currents (cont.) C HF
 C HF")
12
C HG HVPS 50 kV A C C HC C HP Basic Charging and Readout Circuit A P A G C HF SR570 current amplifier (pA)
")
13
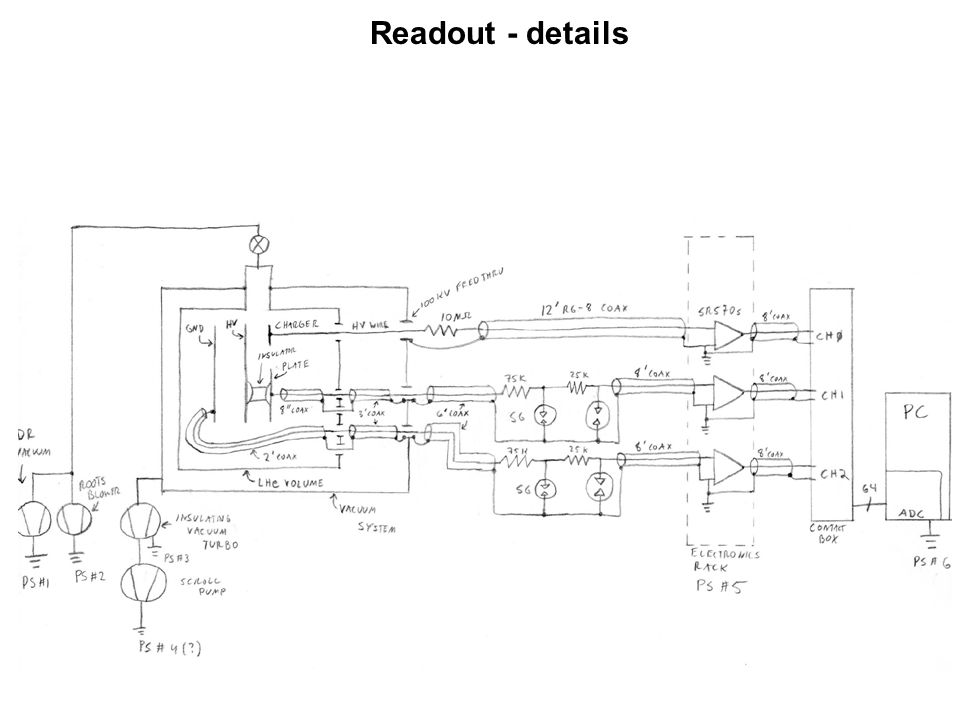
Readout - details

15
Amplification Measurement C HG C HP A P A G C HC A C - - ++ A P A G A C - - - - +++ + + i - i

16
Amplification Measurement C HG C HP A P A G C HC A C - - ++ A P A G A C - - - - +++ + + i - i Easiest (stays fixed, large gap, smaller errors)
")
17
Amplification Measurement C HG C HP A P A G C HC A C - - ++ A P A G A C - - - - +++ + + i - i Easiest (stays fixed, large gap, smaller errors)
")
18
Maximum voltages attained – 04/07 Maximum potentials sustained: 10.5 liters Normal State (4.38 K), 6.4 cm gap: (760 ± 70) kV = (119 ± 11) kV/cm 8.2 liters SF at 2.14 K, 5.0 cm gap: (290 ± 40) kV = (58 ± 8) kV/cm RangesComparison with previous results (means) ~20% improvement with extrapolation to 7.5 cm gap
, 6.4 cm gap: (760 ± 70) kV = (119 ± 11) kV/cm 8.2 liters SF at 2.14 K, 5.0 cm gap: (290 ± 40) kV = (58 ± 8) kV/cm RangesComparison with previous results (means) ~20% improvement with extrapolation to 7.5 cm gap")
19
Improved initial gap capacitance Capacitance of HV electrode at small electrode gap: Can now charge larger ( ~ 25%) initial capacitance to same initial voltage (35-40 kV): expect ~ 25% improvement Range of start gaps, 4/07 Previous start gap Likely the result of careful shimming of gap before 4/07 tests
 initial capacitance to same initial voltage (35-40 kV): expect ~ 25% improvement Range of start gaps, 4/07 Previous start gap Likely the result of careful shimming of gap before 4/07 tests")
20
V 0 > 0.95 V 0 MAX V 0 ~ 0.8 V 0 MAX V 0 ~ 0.5 V 0 MAX 4.4 K (18 tests)6/68/84/4 2.1 K (14 tests)0/42/42/6 V0V0 T Charging “statistics:” Established initial gap breakdown of V 0 MAX # successes # attempts to charge at some fraction of V 0 MAX System performance at and below maximum voltage Recorded: V 0 > 0.95 V 0 MAX V 0 ~ 0.8 V 0 MAX V 0 ~ 0.5 V 0 MAX 4.4 K (18 tests)2/6(?)0/80/4 2.1 K (4 tests)0/01/20/2 V0V0 T Number of breakdowns during amplification:
6/68/84/4 2.1 K (14 tests)0/42/42/6 V0V0 T Charging statistics: Established initial gap breakdown of V 0 MAX # successes # attempts to charge at some fraction of V 0 MAX System performance at and below maximum voltage Recorded: V 0 > 0.95 V 0 MAX V 0 ~ 0.8 V 0 MAX V 0 ~ 0.5 V 0 MAX 4.4 K (18 tests)2/6( )0/80/4 2.1 K (4 tests)0/01/20/2 V0V0 T Number of breakdowns during amplification:")
21
Leakage Current 04/07 – Traditional Method Q HV = (0.3 ± 2.4) nC i LEAK ≤ 220 pA (95% C. L.) _ AVERAGE leakage current along ALL paths during holding time t between amplification (moving out) and attenuation (moving in): Q HV = (-0.4 ± 16) nC i LEAK ≤ 5 nA (95% C. L.) _ 4.4 K ( t ~ 7 hr): 2.1 K ( t ~ 11 min):
 _ AVERAGE leakage current along ALL paths during holding time t between amplification (moving out) and attenuation (moving in): Q HV = (-0.4 ± 16) nC i LEAK ≤ 5 nA (95% C. L.) _ 4.4 K ( t ~ 7 hr): 2.1 K ( t ~ 11 min):.")
22
Resting Current 04/07 – Direct monitoring Leave system at maximum gap Set current amplifiers to maximum possible sensitivity (resolution ~ 0.01 pA [?]) Take data at 500 Hz (input filter: 100 Hz, 12 dB/octave) for ~ 500 s InsulatorsGND electrode Charger 0 kV 150 kV 290 kV 2.1 K data: N/A (bad connection)?
![Resting Current 04/07 – Direct monitoring Leave system at maximum gap Set current amplifiers to maximum possible sensitivity (resolution ~ 0.01 pA [ ]) Take data at 500 Hz (input filter: 100 Hz, 12 dB/octave) for ~ 500 s InsulatorsGND electrode Charger 0 kV 150 kV 290 kV 2.1 K data: N/A (bad connection)](http://images.slideplayer.com/27/8984692/slides/slide_22.jpg "Resting Current 04/07 – Direct monitoring Leave system at maximum gap Set current amplifiers to maximum possible sensitivity (resolution ~ 0.01 pA [ ]) Take data at 500 Hz (input filter: 100 Hz, 12 dB/octave) for ~ 500 s InsulatorsGND electrode Charger 0 kV 150 kV 290 kV 2.1 K data: N/A (bad connection)")
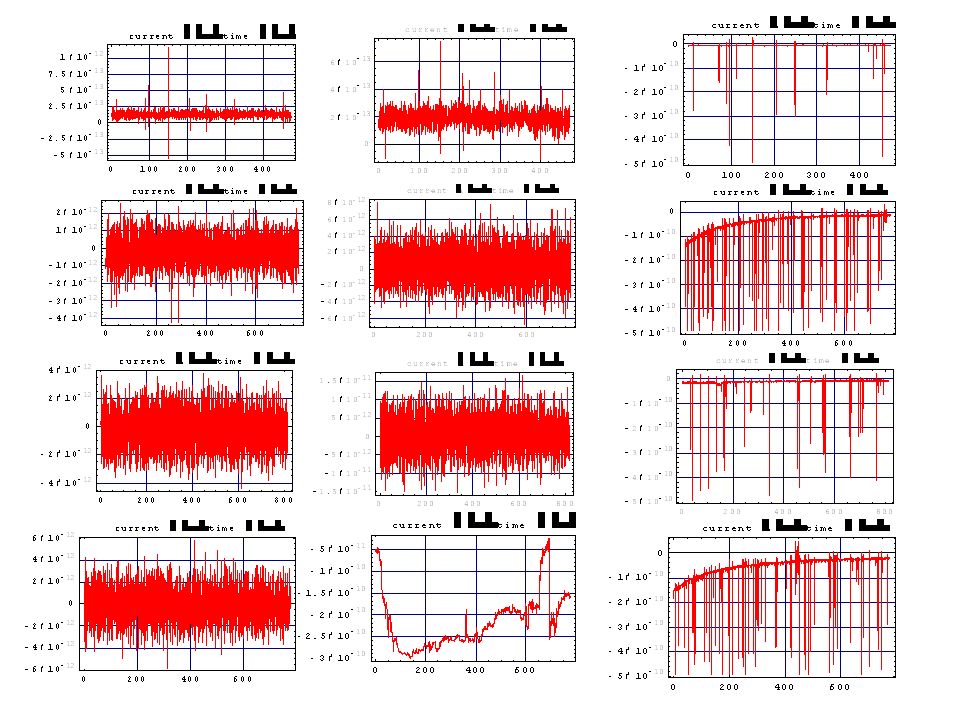
23
0 kV 150 kV 290 kV ~ 1s time slices of Insulator current data (60 Hz) (no obvious scaling)
 (no obvious scaling)")
24
InsulatorGroundCharger 0(offset)0.11 -3.4 1500.20NA67.4 2890.57NA61.7 ch V Resting Current 04/07 – Direct monitoring Average current (pA), 2.1 K data Avg Insulator current vs voltage
 NA NA61.7 ch V Resting Current 04/07 – Direct monitoring Average current (pA), 2.1 K data Avg Insulator current vs voltage")
25
InsulatorGroundCharger 0(offset)0.130.19-8.2 -375-0.150.44-50.0 -525-0.180.59-14.0 -749-0.13NA-59.0 Resting Current 04/07 – Direct monitoring Average current (pA), 4.4 K data Avg Insulator current vs voltage
 NA-59.0 Resting Current 04/07 – Direct monitoring Average current (pA), 4.4 K data Avg Insulator current vs voltage")
26
Resting current spectra – 4K Sample rate = 500 Hz Amplifier input filter 100 Hz, 12 dB/octave Insulators: Ground electrode:

27
Resting current spectra – 4K Sample rate = 500 Hz Amplifier input filter 100 Hz, 12 dB/octave Charger:

28
Resting current spectra – 4K mean values at ~ 50 Hz (picometer oscillations cause 100 fA currents??) A/m Transducer effect?
 A/m Transducer effect")
29
Resting current spectra – 4K and 2K Sample rate = 500 Hz Amplifier input filter 100 Hz, 12 dB/octave Insulator data only Factor ~ 10 greater noise below 10 Hz Mean amplitude decreases with applied voltage Beating of 2 additional pumps? (switching off pumps does NOT improve breakdown)
.")
30
Resting current spectra – 4K, pumps off Sample rate = 500 Hz Amplifier input filter 100 Hz, 12 dB/octave Insulator data shown LHe boil-off increases significantly (“white” effect?) over course of measurement
 over course of measurement")
31
Resting current spectra – 4K, HV fixed vs floating Insulators: Ground electrode: Set gap to 2.3 cm (ground connection OK) Applied 40 kV with charger fixed to HV Took ~ 5 min. data Retracted charger Took ~ 5 min. data Time-averaged insulator currents: 0.05 pA (HV floating) 0.18 pA (HV fixed)
 0.18 pA (HV fixed).")
32
Conclusions Initial capacitance, smooth electrode features crucial factors in system performance No obvious breakdown / leakage current problems with (uncoated) acrylic Stability/performance of system below 2.2 K (35 torr) still serious concern Some trends in dc and ac resting current with applied voltage and fixed vs floating HV electrode, but no serious degradation Readout needs improvement for sensitivity to small signals
 acrylic Stability/performance of system below 2.2 K (35 torr) still serious concern Some trends in dc and ac resting current with applied voltage and fixed vs floating HV electrode, but no serious degradation Readout needs improvement for sensitivity to small signals")
33
V 0 > 0.95 V 0 MAX V 0 > 0.8 V 0 MAX V 0 > 0.5 V 0 MAX 4.4 K (18 tests)6/614/1418/18 2.1 K (14 tests)0/42/84/14 V0V0 T Charging “statistics:” Established initial gap breakdown of V 0 MAX # successes # attempts to charge above some fraction of V 0 MAX System performance at and below maximum voltage Recorded: V 0 > 0.95 V 0 MAX V 0 > 0.8 V 0 MAX V 0 > 0.5 V 0 MAX 4.4 K (18 tests)2/62/142/18 2.1 K (4 tests)0/01/21/4 V0V0 T Number of breakdowns during amplification:
6/614/1418/ K (14 tests)0/42/84/14 V0V0 T Charging statistics: Established initial gap breakdown of V 0 MAX # successes # attempts to charge above some fraction of V 0 MAX System performance at and below maximum voltage Recorded: V 0 > 0.95 V 0 MAX V 0 > 0.8 V 0 MAX V 0 > 0.5 V 0 MAX 4.4 K (18 tests)2/62/142/ K (4 tests)0/01/21/4 V0V0 T Number of breakdowns during amplification:")
34
John Ramsey, LANL Design finished this week Procurement by end June Need technician to assemble and install New inner (4K) shield
 shield")
37
Leakage Current 12/06 – Traditional Method Q HV = (6.8 ± 2.6) C i LEAK = (8.6 ± 3.3) nA _ AVERAGE leakage current along ALL paths during holding time t between amplification (moving out) and attenuation (moving in):
 C i LEAK = (8.6 ± 3.3) nA _ AVERAGE leakage current along ALL paths during holding time t between amplification (moving out) and attenuation (moving in):")
38
Leakage current 12/06 – Direct Monitoring Output of current amplifier on plate (insulators): 15 10 5 0 0200400600800 Current (nA) vs time (s) 3 2 1 0 0200400600800 Integrated Current ( C) vs time (s) 4
: Current (nA) vs time (s) Integrated Current ( C) vs time (s) 4")
39
Leakage current 12/06 – Direct Monitoring Q P = 4.4 ± 0.1 C (zero drift only) Output of current amplifier on plate (insulators): 15 10 5 0 0200400600800 Current (nA) vs time (s) 3 2 1 0 0200400600800 Integrated Current ( C) vs time (s) 4 i LEAK = (5.5 ± 0.2) nA _
 Output of current amplifier on plate (insulators): Current (nA) vs time (s) Integrated Current ( C) vs time (s) 4 i LEAK = (5.5 ± 0.2) nA _")
40
Leakage current 12/06 – Direct Monitoring Q P = 4.4 ± 0.1 C (zero drift only) Output of current amplifier on plate (insulators): 15 10 5 0 0200400600800 Current (nA) vs time (s) 3 2 1 0 0200400600800 Integrated Current ( C) vs time (s) 4 i LEAK = (5.5 ± 0.2) nA _ Q HV = (6.8 ± 2.6) C i LEAK = (8.6 ± 3.3) nA _ Consistent with traditional result but room for several nA leakage elsewhere
 Output of current amplifier on plate (insulators): Current (nA) vs time (s) Integrated Current ( C) vs time (s) 4 i LEAK = (5.5 ± 0.2) nA _ Q HV = (6.8 ± 2.6) C i LEAK = (8.6 ± 3.3) nA _ Consistent with traditional result but room for several nA leakage elsewhere")
41
Leakage current 12/06 – Direct Monitoring Q G = 2.21 ± 0.07 C (zero drift only) Output of current amplifier on ground electrode: -0.5 -1.5 -2.0 0200400600800 Integrated Current ( C) vs time (s) 0.0 0 -2 -4 -6 0200400600800 Current (nA) vs time (s) -8
 Output of current amplifier on ground electrode: Integrated Current ( C) vs time (s) Current (nA) vs time (s) -8")
42
Leakage current 12/06 – Direct Monitoring Q G = 2.21 ± 0.07 C (zero drift only) Output of current amplifier on ground electrode: -0.5 -1.5 -2.0 0200400600800 Integrated Current ( C) vs time (s) 0.0 0 -2 -4 -6 0200400600800 Current (nA) vs time (s) -8 A P A G A C + ++ - - - - i + i - i A P A G A C + +++ - - - - - - - - -- Expectation if +6.8 nC leaked off HV via path other than C HG :
 Output of current amplifier on ground electrode: Integrated Current ( C) vs time (s) Current (nA) vs time (s) -8 A P A G A C i + i - i A P A G A C Expectation if +6.8 nC leaked off HV via path other than C HG :")
Similar presentations


 Future.>")
>")
 shielding the overhead lines.>")

 LHe.>")


 Recycler Meeting January 21, 2009 A. Shemyakin.>")

