Download presentation
Presentation is loading. Please wait.

1
Cloud optical properties: modeling and sensitivity study Ping Yang Texas A&M University May 28,2003 Madison, Wisconsin

2
Cloud optical properties: modeling and sensitivity study Part 1: Fast radiative transfer code for radiative transfer under cloudy condition Part 1 Part 2: Sensitivity of high-spectral- resolution-infrared radiance to cirrus properties Part 2

3
Part 1: Fast radiative transfer code under cloudy condition Calculations of the single-scattering properties (extinction efficiency, absorption efficiency and asymmetry factor) of ice and water cloud particles Bulk optical properties of ice and water clouds, and parameterization Radiative transfer model under cloudy condition
 of ice and water cloud particles Bulk optical properties of ice and water clouds, and parameterization Radiative transfer model under cloudy condition")
4
Continued Database of albedo and tansmissivity function for water and cirrus clouds and fast search code Merge the fast model for clouds with clear sky model Results

5
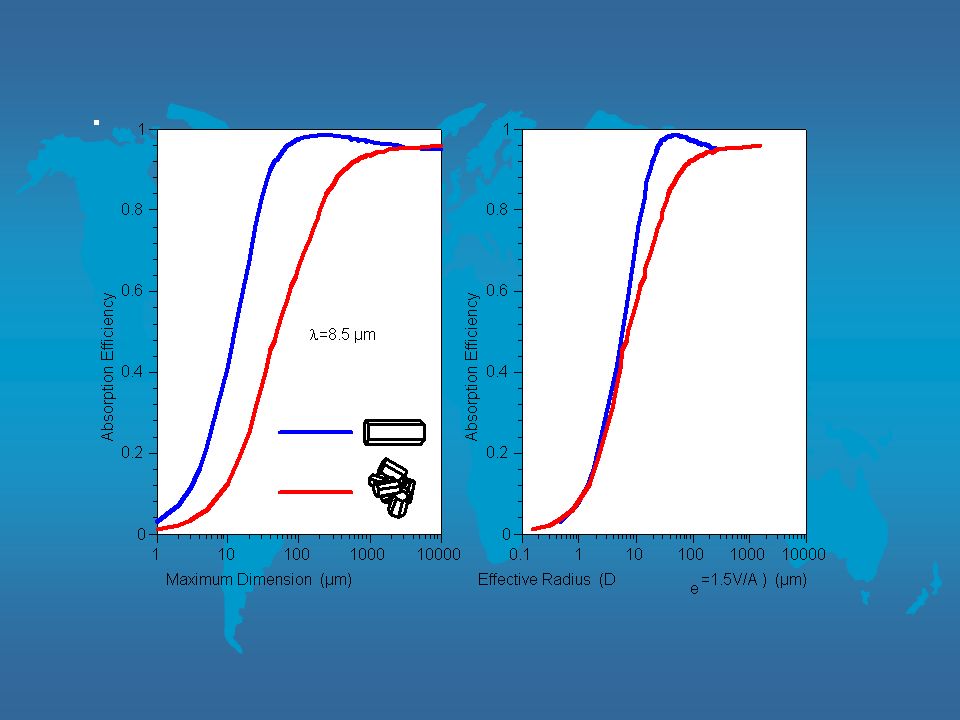
A composite method for the calculation of the single-scattering properties of ice crystals

6
Bulk optical properties of cirrus clouds and parameterization

7
The mean extinction efficiency, absorption efficiency, asymmetry factor, and single- scattering albedo for water clouds

8
The scheme of radiative transfer for clouds

9
Where: are clear sky atmospheric transmission from the out space to the surface and to cloud top, respectively. and

10
Database of albedo and tansmissivity function for water and ice clouds For ice clouds: Optical thickness: 0.04-50 Effective size: 10-157µm Zenith angle: (0-80 o ) Wavenumber:(500-2500cm -1 ) For water clouds: Optical thickness: 0.06-150 Effective size: 2-20 µm Zenith angle: (0-80 o ) Wavenumber:(500-2500cm -1 )
 Wavenumber:( cm -1 ) For water clouds: Optical thickness: Effective size: 2-20 µm Zenith angle: (0-80 o ) Wavenumber:( cm -1 )")
11
Transmissivity vs. wavenumber for 4 effective sizes ( cirrus cloud, Tau=1.0)
")
12
Transmissivity vs. wavenumber for 4 optical thicknesses ( ice cloud, D ei =50µm)
")
13
Transmissivity vs. optical thickness for 4 effective sizes ( cirrus cloud, =8µm)
")
14
The transmissivity function vs. zenith angle at 4 optical thicknesses for ice clouds

15
Albedo vs. wavenumber for 4 optical thicknesses ( cirrus cloud)
")
16
Albedo vs. wavenumber for 4 effective sizes ( cirrus cloud)
")
17
Albedo vs. effective size for 4 optical thicknesses ( cirrus cloud, =8µm)
")
18
Albedo function vs. optical thicknesses for 4 effective sizes (cirrus cloud)
")
19
Albedo vs. zenith angle for 4 optical thicknesses (cirrus cloud)
")
20
Interpolate albedo and transmissivity from database A code is developed to interpolate albedo and transmissivity from a pre-calculated database for given wavelength, zenith angle, effective sizes and optical thickness (cirrus and water clouds) by using two-dimensional (2D) polynomial fitting and 2D interpolation
 by using two-dimensional (2D) polynomial fitting and 2D interpolation")
21
Interpolate transmissivity of clouds from the pre-calculated database

22
Interpolate albedo of clouds from the pre-calculated database

23
Merge the cloudy and clear-sky fast models l We developed a computational package to compute the radiance at any atmospheric level for given profiles of clear-sky atmospheric optical thickness and temperature (which are from the clear sky fast model) and the parameters of clouds
 and the parameters of clouds")
24
Results Accuracy l The root-mea- square(RMS) difference between the fast model and DISORT is less than 0.5K, as illustrated in the attached diagrams attached diagrams Speed: The computational speed of the fast model is approximately 1000 times faster than the DISORT model. Test case: 8000 wavenumbers(500-2500cm -1 ) and 100 layers atmosphere with single-layer clouds on Dell Precision 530 workstation. It takes 254s for DISORT whereas the fast model needsonly 0.25s.
 and 100 layers atmosphere with single-layer clouds on Dell Precision 530 workstation. It takes 254s for DISORT whereas the fast model needsonly 0.25s..")
25
Spectra calculated by the fast model and the deviations compared with DISORT

26
Comparison of the results from the fast model and the DISORT model

27
Comparison of the results from the fast model and DISORT(variation of BT versus effective size)
")
28
Comparison of the results from the fast model and DISORT(variation of BT versus optical thickness)
")
29
Comparisons the results of the fast model to DISORT(variation of BT versus zenith angle)
")
30
Comparisons the results of the fast model to DISORT for water clouds

31
Part 2:Sensitivity study of Cirrus Properties Sensitivity study Effective particle size Visible optical thickness Simultaneous retrieval of the optical thickness and effective particle size of cirrus clouds

32
The sensitivity of upwelling brightness temperature to the effective size of cirrus clouds

33
The sensitivity of the slope to the effective size of cirrus clouds

34
Sensitivity of the slope to the effective size and optical thickness of cirrus clouds

35
Sensitivity of upwelling brightness temperature to the optical thickness of cirrus clouds

37
Comparison of observed and simulated upwelling IR spectra for a jet contrail composed of primarily small ice particles.

38
Cloud Lidar System (CLS) image
 image")
39
Observed and simulated upwelling IR spectra for cirrus and water cloud conditions

40
The simultaneous retrieval of the effective size and optical thickness from HIS spectra

41
l Improve the modeling of the single-scattering properties of clouds (ice, water and mixed-phase clouds) –More realistic habits –Recent microphysical measurement (e.g., CRYSTAL- FACE data) l Improve the speed and accuracy of the fast cloudy radiative transfer model l Consider multi-layered cloud system l Fast model for mixed-phase clouds Plan for Next Year
 –More realistic habits –Recent microphysical measurement (e.g., CRYSTAL- FACE data) l Improve the speed and accuracy of the fast cloudy radiative transfer model l Consider multi-layered cloud system l Fast model for mixed-phase clouds Plan for Next Year")
44
Test of Cirrus Scattering Model developed by Yang et al. for MODIS ATSR-2 Data at 0.65 m 21 July, 1996; Latitude -32.5 o ; Longitude -95.9 o (Courtesy of A. Baran, UK Met Office)
.")
45
ATSR-2 Cirrus Results 21 July, 1996; Latitude -32.5 o ; Longitude -95.9 o ; Scattering angle: 118.9 o (nadir) (Courtesy of A. Baran, UK Met Office)
.")
46
ATSR-2 Data at 0.65 m 23 July, 1996; Latitude -10.1 o ; Longitude -122.6 o False Color Image R: 0.65 m reflectance G: 0.87 m reflectance B: 1.6 m reflectance (Courtesy of A. Baran, UK Met Office)
.")
48
Thank you!

Similar presentations


 used for climate research and prediction.>")


 University of Hawaii (UH) Texas A& M (TAMU) University of Colorado at Boulder (CU) University of Alabama in Huntsville.>")


 Ann Fridlind, Andrew Ackerman & Brian Cairns (NASA GISS) An investigation of ice crystal sizes.>")
 University of Hawaii (UH) Texas A& M (TAMU) University of Colorado at Boulder (CU) University of Alabama in Huntsville.>")
