Download presentation
Presentation is loading. Please wait.

1
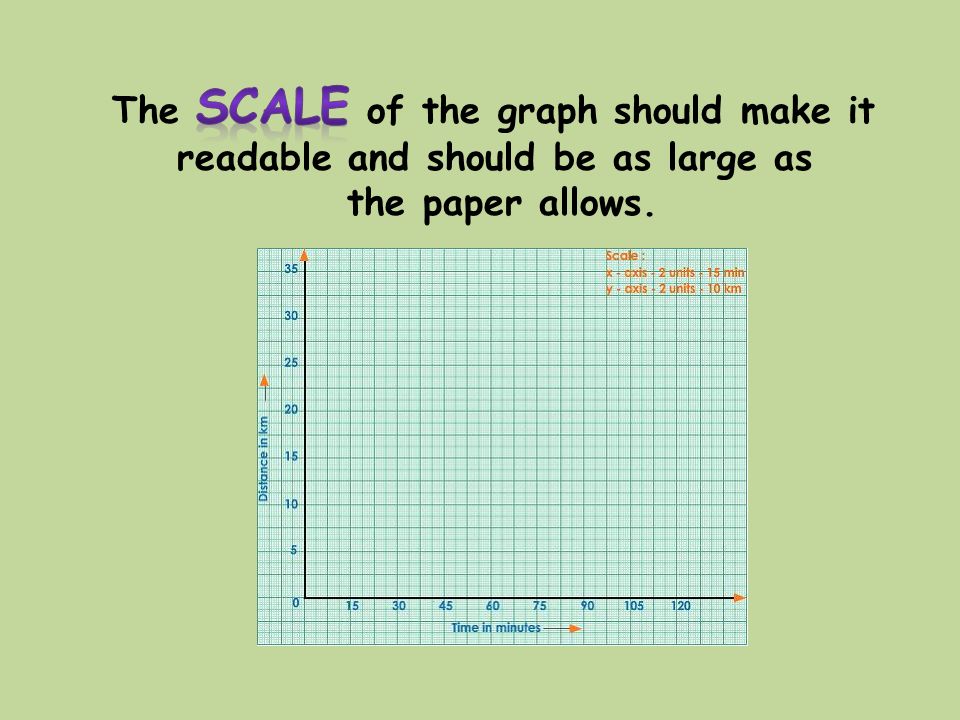
Graphs

8
Title Examples Students in Each Grade at Aitkin High School Height of Students in Ms DelZoppo’s First Hour Class Students Favorite Lunch at AHS Height of Corn Plants Given No Fertilizer

9
Unit Examples time (s) distance meters (m) distance kilometers (km) number of students number of days color
 distance meters (m) distance kilometers (km) number of students number of days color")
10
Time for you to make a graph First will be a line graph of Average Earth Temperature for the past 13 decades. Decade °F 1880s 56.71 1890s 56.74 1900s 56.73 1910s 56.70 1920s 56.89 1930s 57.12 1940s 57.26 1950s 57.16 1960s 57.18 1970s 57.20 1980s 57.52 1990s 57.76 2000s 58.12

Similar presentations


 vector B.) scalar C.) additive D.) subtractive.>")

 which helps the.>")
 Catalyst: Name as many types of graphs as you can!>")


 Communicate data through tables and graphs. (2) Create appropriate graphs based on data.>")


