Download presentation
Presentation is loading. Please wait.

1
Chapter 3 Key Issue 3 Why is population increasing at different rates in different countries?

2
Demographic Transition Model Demographic Transition Model All countries have experienced some changes in natural increase, fertility, and morality rates at different times and at different rates. All countries have experienced some changes in natural increase, fertility, and morality rates at different times and at different rates. Although rates vary among countries, a similar process of change is operating Although rates vary among countries, a similar process of change is operating Because of local cultural and economic conditions, the demographic transition diffuses to individual countries at different rates Because of local cultural and economic conditions, the demographic transition diffuses to individual countries at different rates

3
Demographic Transition Model Stage 1: Low Growth Stage 1: Low Growth HIGH BIRTH and DEATH rates HIGH BIRTH and DEATH rates Most of Humanity’s occupancy on earth Most of Humanity’s occupancy on earth People depended on Hunting/Gathering People depended on Hunting/Gathering Food supplies were unpredictable Food supplies were unpredictable War War Disease- no modern medicine Disease- no modern medicine Pre- Industrial Revolution Pre- Industrial Revolution NO COUNTRY STILL IN STAGE ONE!!!! NO COUNTRY STILL IN STAGE ONE!!!!

4
Stage 2: High Growth Death rate drops, Birth Rate stays high Death rate drops, Birth Rate stays high Occurred in most countries during 18 th and 19 th centuries, during the Industrial Revolution. Occurred in most countries during 18 th and 19 th centuries, during the Industrial Revolution. Improved sanitation/hygiene Improved sanitation/hygiene Improved medical practices Improved medical practices More food available/ new technology More food available/ new technology CBR high, NIR high = rapid growth CBR high, NIR high = rapid growth MDC’s went through stage 2 by 1800’s MDC’s went through stage 2 by 1800’s LDC’s didn’t start in stage 2 until 1950’s LDC’s didn’t start in stage 2 until 1950’s Thanks to medical revolution Thanks to medical revolution Several periphery nations still in Stage 2 Several periphery nations still in Stage 2

5
Stage 3: Moderate Growth Birth rate begins to drop, death rate low Birth rate begins to drop, death rate low Pop still grows because CBR still higher than CDR NIR slows MDC’s moved into stage 3 in early 1900’s Most Asian and Latin American countries today Sudden drop of birth rates due to changes in social customs Economic changes Urban societies

6
Stage 4: Low Growth Reaches stage when zero population growth is achieved. Reaches stage when zero population growth is achieved. BR=DR BR=DR NIR = 0 NIR = 0 Called zero population growth (ZPG) Called zero population growth (ZPG) below replacement level below replacement level Mainly Europe and United States Mainly Europe and United States Changes in lifestyle encourage small families Changes in lifestyle encourage small families Countries that have NEGATIVE growth: Countries that have NEGATIVE growth: Russia and other Eastern European Countries Cause: Communist Rule
 Called zero population growth (ZPG) below replacement level below replacement level Mainly Europe and United States Mainly Europe and United States Changes in lifestyle encourage small families Changes in lifestyle encourage small families Countries that have NEGATIVE growth: Countries that have NEGATIVE growth: Russia and other Eastern European Countries Cause: Communist Rule.")
7
5 th stage? 5 th stage? Not identified yet Not identified yet Characterized by higher CDR than CBR Characterized by higher CDR than CBR Irreversible population decline Irreversible population decline Japan? Japan? Japan? Italy? Italy? Russia? Russia?

8
ENGLAND EXAMPLE Stage 1 Stage 1 Pre-1750 Pre-1750 Norman invasion 1066 Norman invasion 1066 Population = 1 million Population = 1 million Black death Black death Famines/ bad harvests Famines/ bad harvests Stage 2 Stage 2 1750: CBR and CDR -40 1750: CBR and CDR -40 By 1800: CBR 34, CDR 20 By 1800: CBR 34, CDR 20 Industrial Revolution Industrial Revolution NIR 1.4%, pop increased from 6- 30 mill NIR 1.4%, pop increased from 6- 30 mill Stage 3 Stage 3 After 1880 After 1880 CBR declined sharply CBR declined sharply Between 1880- 1970 pop only increased.7 % per year Between 1880- 1970 pop only increased.7 % per year Stage 4 Stage 4 Since 1970s CBR/ CDR even TFR below replacement levels

9
EXAMPLES Cape Verde:Chile: Stage 3 Denmark stage 2 stage 4 stage 2 stage 4

10
WHY ISN”T EVERY COUNTRY AT STAGE 4???? Demographic change Demographic change Sudden decline in CDR Sudden decline in CDR Core nations: Core nations: Industrialization led to wealth Industrialization led to wealth Wealth led to scientific innovations Wealth led to scientific innovations Semi/ Periphery nations: Semi/ Periphery nations: Diffusion of scientific and technological innovations Diffusion of scientific and technological innovations All have accepted technology (vaccines, medications, etc.) All have accepted technology (vaccines, medications, etc.) BUT….not all countries have “changed” social customs BUT….not all countries have “changed” social customs
 All have accepted technology (vaccines, medications, etc.) BUT….not all countries have changed social customs BUT….not all countries have changed social customs.")
11
Demographic Transition and World Population Growth Huge population explosion during 2 nd ½ of 20 th century Huge population explosion during 2 nd ½ of 20 th century No country in stage 1, few in stage 4 No country in stage 1, few in stage 4 Causes Causes Drop in DR b/c of technology Drop in DR b/c of technology Drop in BR b/c of change in social custom Drop in BR b/c of change in social custom

12
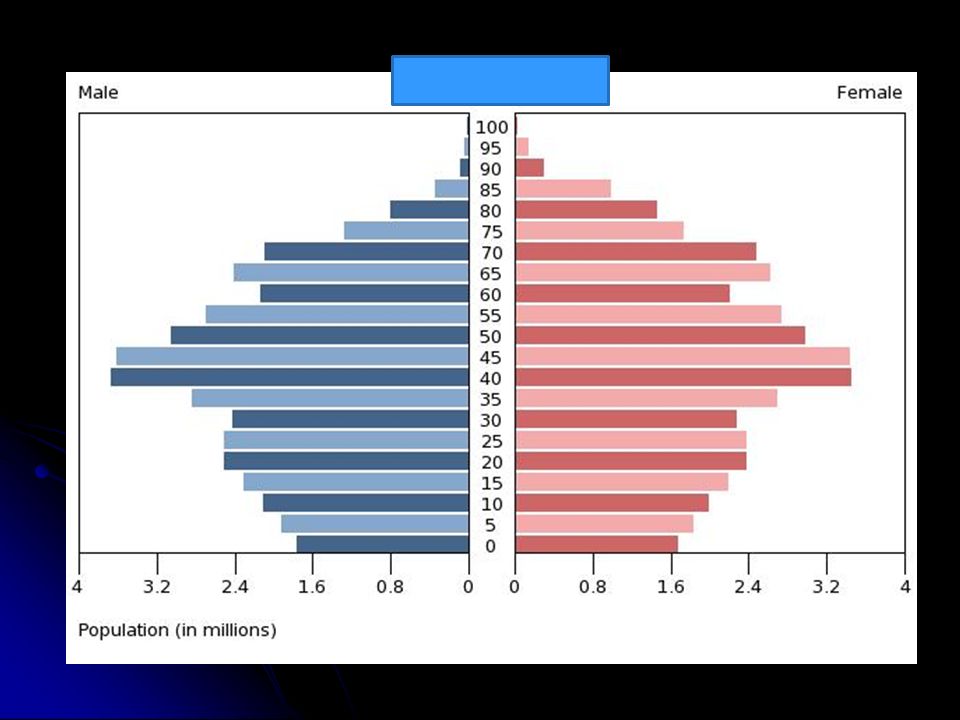
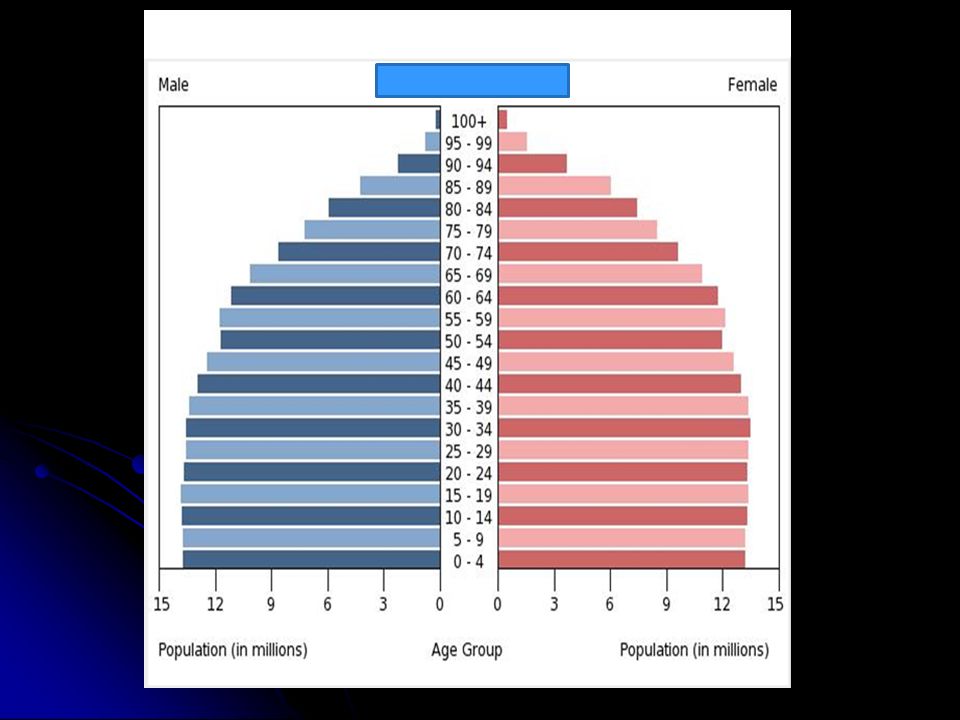
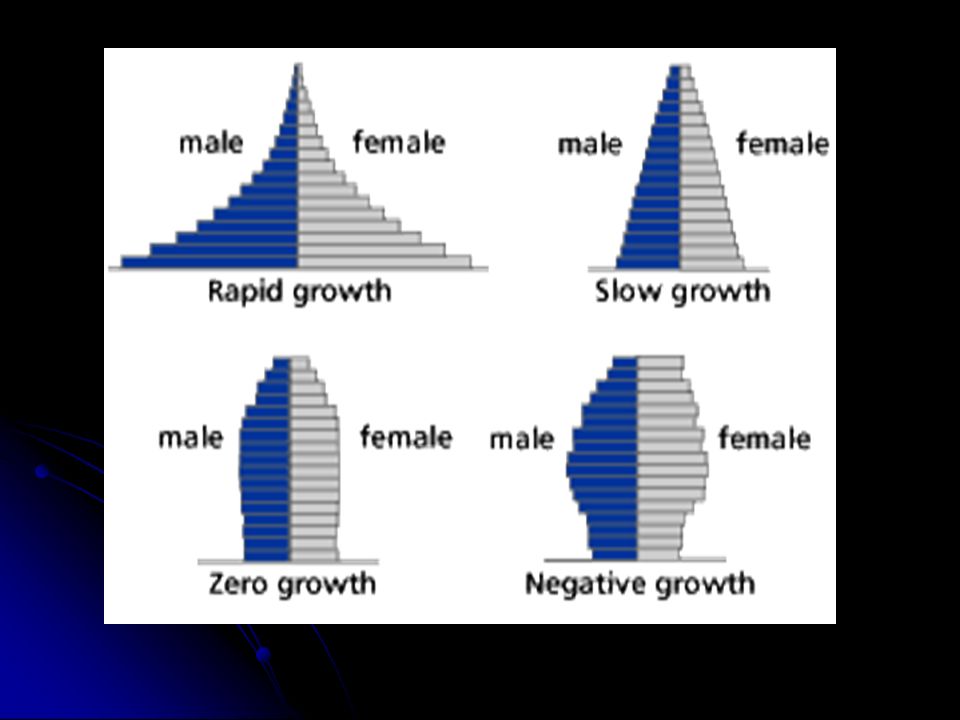
Population Pyramids Population Pyramids A population pyramid is a bar graph that displays age and gender of a population A population pyramid is a bar graph that displays age and gender of a population Males on left, females on right Males on left, females on right 5 year age groups 5 year age groups Shape determined by CBR Shape determined by CBR Demographic transition gives a country a distinctive population structure Demographic transition gives a country a distinctive population structure Influenced by: Influenced by: % of Population in each age group % of Population in each age group Distribution of Male and Females Distribution of Male and Females

13
Age Distribution Age Distribution Most important factor is dependency ratio: Most important factor is dependency ratio: dependency ratio dependency ratio # of people too old or young to work compared to the # of people in their productive years # of people too old or young to work compared to the # of people in their productive years Three age groups: Three age groups: - 0 – 14 - 0 – 14 - 15 – 64 - 15 – 64 - 65 + - 65 + ½ of all people in stage 2 countries (LDCs/ Periphery) are dependent ½ of all people in stage 2 countries (LDCs/ Periphery) are dependent Mainly young 1/3 of all people in MDC’s (Core) are dependent 1/3 of all people in MDC’s (Core) are dependent Mainly old
 are dependent ½ of all people in stage 2 countries (LDCs/ Periphery) are dependent Mainly young 1/3 of all people in MDC’s (Core) are dependent 1/3 of all people in MDC’s (Core) are dependent Mainly old")
14
Problems The large amount of Children in Africa strain resources The large amount of Children in Africa strain resources “graying” populations of U.S. and Europe are burdens on the government “graying” populations of U.S. and Europe are burdens on the government

15
Sex Ratio # of males # of males per hundred per hundredFemales Stage 2 countries have low % of women due to childbirth deaths Stage 2 countries have low % of women due to childbirth deaths

16
Population Pyramids Allows demographers to identify changes Allows demographers to identify changes Population cohorts Population cohorts Group of individuals who share a common temporal demographic experience Group of individuals who share a common temporal demographic experience Example: Example: Deficit of births after a war Deficit of births after a war

17
Population Pyramid Practice

Similar presentations


>")


