Download presentation
Presentation is loading. Please wait.

1
AP Stats Nationals Review

3
Data: Quantitative (Histogram, Stem & Leaf, Boxplots) versus Categorical (Bar or Pie Chart) Boxplots: 5 Number Summary, IQR, Outliers???, Comparisons Center, Shape & Spread! For Skewed Data use…median & IQR For Symmetric data use…mean & SD Normal Model (68 - 95 - 99.7), SD & z-scores
, SD & z-scores.")
4
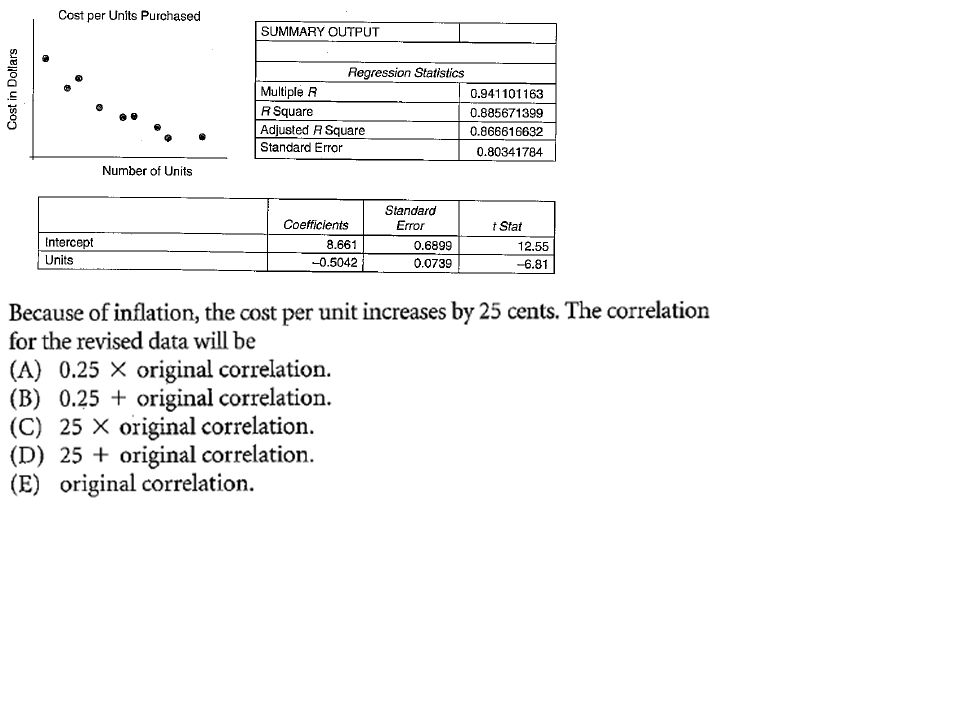
Scatterplots ~ direction, form & scatter – Variables: explanatory & response – Correlation: r, r-squared, strength & direction. Z-score world versus slope. Linear Model ~ equation, interpretation, residuals Problems – Extrapolation, lurking variables – Outliers & influential points/leverage Re-Expression & Ladder of Powers

27
M.C. Tips Underline key words Write out your procedure Don’t Rush Balance your time (2-3 min per ???)
.")
28
F.R. Tips Do easier ???’s first Answer the ??? Asked (underline) If miss 1 part, answer a part you know Inference: Conditions/Mechanics/Conclusion Be concise Verify conditions (not just a checklist) 2 decimal places for z-scores, 4 for p-values Context is King!!!
 If miss 1 part, answer a part you know Inference: Conditions/Mechanics/Conclusion Be concise Verify conditions (not just a checklist) 2 decimal places for z-scores, 4 for p-values Context is King!!!.")
Similar presentations


 versus Categorical (Bar or Pie Chart) Boxplots: 5 Number Summary, IQR, Outliers???, Comparisons.>")


 – Exploring Data Unit II (Chapters 7-10) - Regression Unit III (Chapters 11-13) - Experiments Unit IV (Chapters 14-17)>")
