Download presentation
Presentation is loading. Please wait.

1
CROPP Cooperative A model of Building Relationships for 7 Rivers Alliance November 4, 2015 Louise Hemstead, COO

2
Our Mission

3
3 Our Business Sustainable and Stable Farmer Pay Price Independent Mission Family Farms Organic Marketing Cooperative Leadership Drivers Identity

4
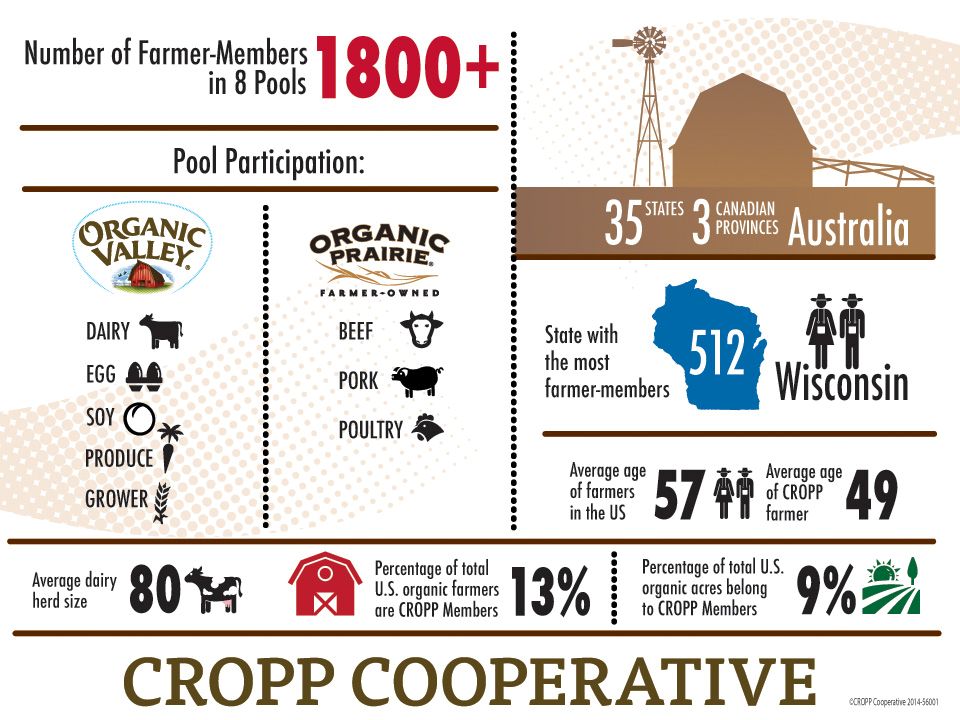
CROPP Cooperative Today 1800 Member Farm Families in 34 States, One Canadian Province and Australia

5
Est. Organic Valley PAY PRICE 25 Years of Sustainable Farmer Pay MIDWEST MAILBOX DAIRY PAY PRICE

7
Fluid milk

8
Innovative Pioneers Organic Production for animal agriculture Supply Management – Managing the economics of supply and demand to create a sustainable pay price for farmers. Relationship Manufacturing – National Presence, regional manufacturing, minimal capital investment

9
Virtual Company Production largely hired Great flexibility Limited investments in plants

10
Farmer Owners 1,800 FARMS Retailer, Distributor, Processing Customers Distribution Center 1 Central 16 Regional Leased Transportation 100 Independent Carriers 90+ Co - Manufacturing Relationships Milk Truck Contract Carriers Own Fleet Millions of Consumer CROPP Supply Chain 500,000 Gallons/Day Freight Independent Carriers 650+ SKU’s

12
Creamery in Chaseburg, Wis.

13
Butter Manufacturing, Chaseburg

14
Chaseburg Ghee Sleever

15
Cheese Conversion Plant, LaFarge

16
Distribution Center in Cashton, Wis.

17
Farm Families 426 As of 06/30/2015 30 Processing Plants CROPP’s Midwest Perspective

19
Wisconsin Manufacturing (Great Diversity) 2010 Annual Survey of Manufacturers*
 2010 Annual Survey of Manufacturers*")
22
Here to Serve Future Generations

23
2015 OTA Organic industry Survey Summary of Key Insights Prepared by Joanna Lottig, Brand Management Coordinator For full report please go to: I:\Marketing\Category Management\Public Access\CIQ - Consumer Intelligence\2015 CIQ\OTA\2015 OTA Organic Industry Survey Executive Summary_FINAL.pptxI:\Marketing\Category Management\Public Access\CIQ - Consumer Intelligence\2015 CIQ\OTA\2015 OTA Organic Industry Survey Executive Summary_FINAL.pptx

24
U.S. Organic Food Sales by Product in 2014 Fruits and Vegetables 36.3% Dairy 15.2% Packaged and Prepared Foods 14.7% Beverages 12.0% Breads and Grains 11.4% Snack Food 5.6% 10.9% Growth in 2014 10.8% Growth in 2014 15.7% Growth in 2014 12.3% Growth in 2014 8.6% Growth in 2014 7.8% Growth in 2014 SOURCE: ORGANIC TRADE ASSOCIATION’S 2015 ORGANIC INDUSTRY SURVEY CONDUCTED 2/10/2015 – 4/3/2015

25
Organic Food Forecasted Growth 2015-2016 vs. 2014 SOURCE: ORGANIC TRADE ASSOCIATION’S 2015 ORGANIC INDUSTRY SURVEY CONDUCTED 2/10/2015 – 4/3/2015

26
Production 27% General or other Office Personal 17% Sales 17% Marketing 10% SOURCE: ORGANIC TRADE ASSOCIATION’S 2015 ORGANIC INDUSTRY SURVEY CONDUCTED 2/10/2015 – 4/3/2015 69% of surveyed organic companies expect to increase full-time employment levels, and 49 % are planning to increase part-time staff. (Employment by Employee Type in 2014)
.")
27
Thank you

Similar presentations