Download presentation
Presentation is loading. Please wait.

1
One System…One Mission Florida’s Student Success Dashboard 2011 American Association of Community Colleges John Hughes, Ph. D

2
The Challenge – Better Leveraging the Data Too often, accountability and outcome measures are disconnected from daily work Do not reflect college priorities Do not represent student body Not linked to college behavior Reporting is burdensome

3
The Challenge – Better Leveraging Data Goal: Link outcome measures to student progress Ensure measures are linked to something that matters – student success Enable colleges to directly influence accountability results Tie to existing processes such as Equity reporting Support colleges in analyzing data No additional reporting requirements

4
Students to Track The measures are based on cohort tracking Based on IPEDS cohort All First-Time in College (FTIC) students in summer or fall term Includes both full and part-time students Includes transfer students Includes dual enrollment students Can be broken down by Developmental education status Age Race Gender Disability status Limited English Proficiency Pell Status
 students in summer or fall term Includes both full and part-time students Includes transfer students Includes dual enrollment students Can be broken down by Developmental education status Age Race Gender Disability status Limited English Proficiency Pell Status")
5
Outcome Measures Completed an award and transferred to a State University Completed an award and with transferring to a State University Transferred without an award Still enrolled with 30 or more college hours Total success rate – sum of all other measures

6
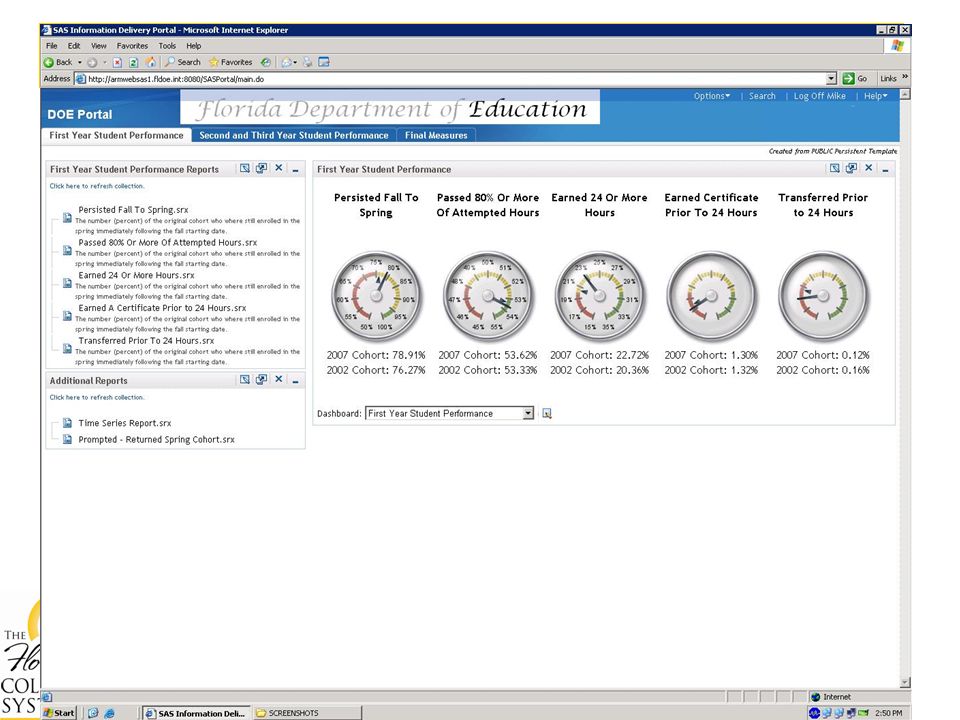
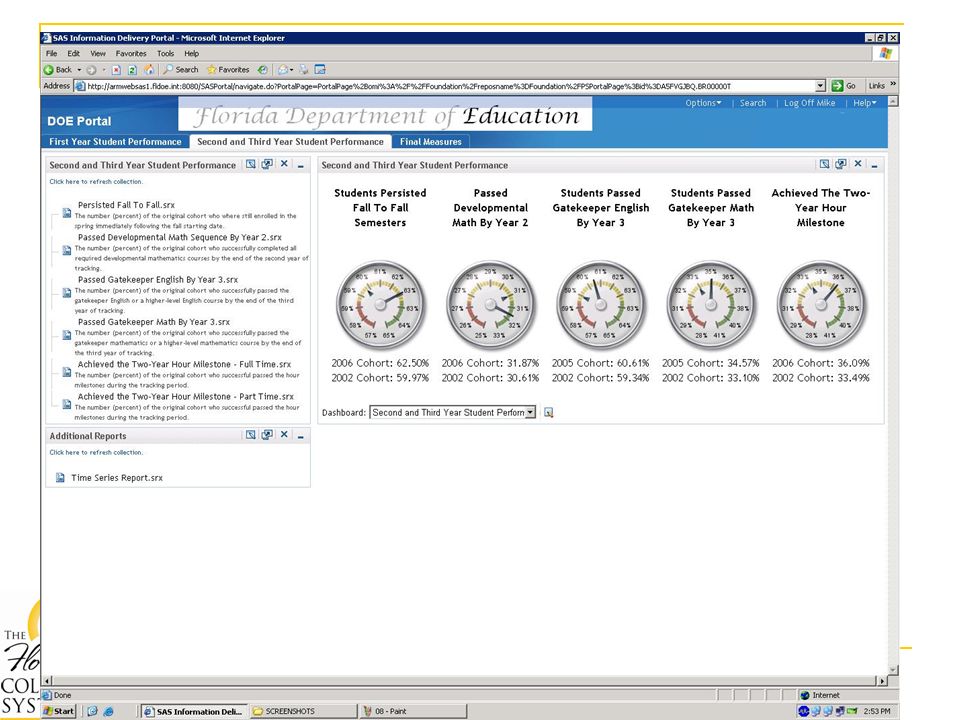
Interim Progress Measures First-Year Progress Measures Persisted fall to spring Passed 80% or more of attempted hours Earned 24 or more hours Second and Third Year Progress Measures Persisted fall to fall Passed developmental education sequence Passed gatekeeper English or higher Passed gatekeeper math or higher Achieved a credit hour milestone

7
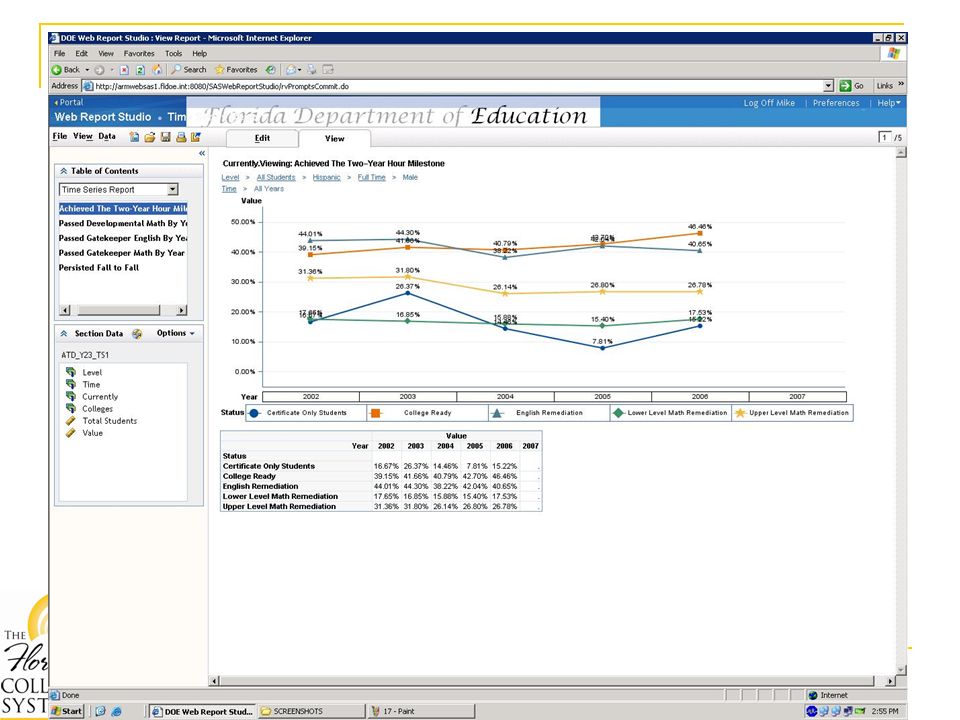
Linking Outcome and Interim Measurement Select a group to track, such as Hispanics Look at their four and six-year outcomes for recent cohort to identify gaps Develop intervention strategies and plans Track performance for incoming cohort Compare to prior cohort Track through graduation to evaluate interventions

8
Start With an Outcome Gap or Area of Low Performance 2004 CohortAward of Associates by Year Four Award of Associates by Year Six Hispanics15%20% Whites18%24% Gap-3%-4%

9
Track Interim Performance Interim Measure2004 Cohort2011 Cohort Persisted fall to spring 82%84% Passed 80% or more of attempted hours 76%70% Earned 24 or more hours 55%52% Earned a certificate or degree prior to 24 hours 1% Transferred prior to 24 hours 1% Persisted fall to fall 71%74% Passed developmental math sequence 33%25% Passed gatekeeper English or higher 26% Passed gatekeeper math or higher 18% Achieved the credit hour milestone 44% Earned Award by year four/six 15%/20%

10
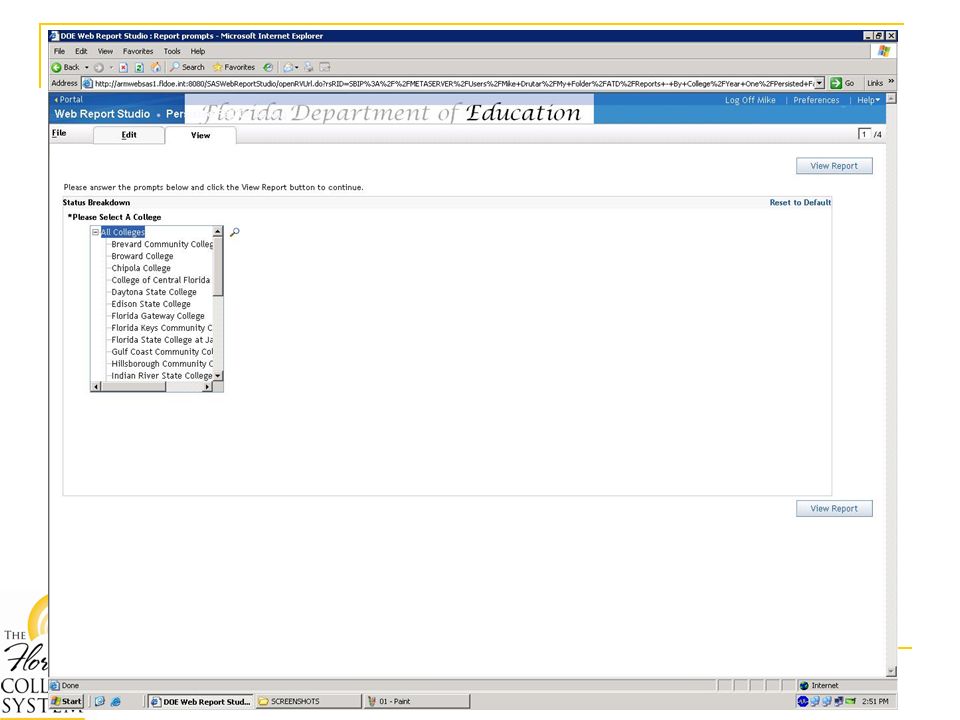
New Tool for Tracking The state office will provide each college access to a performance dashboard Will have static reports Will also provide dynamic access to outcome data Develop local reports Updates automatically each year

18
Going Beyond the Interim Measures Dashboard updates once per year Colleges can track students more often Identify the students in each cohort Track registrations, drop/add, and withdrawals Look at mid-term grades Utilize student support services Colleges can, for the first time, directly link their interventions with accountability results

19
One System…One Mission Florida’s Student Success Dashboard John Hughes, Ph. D John.hughes@fldoe.org 850-245-9482

Similar presentations


 Michigan Department of Education Office of Psychometrics, Accountability, Research, & Evaluation Summer.>")


