Download presentation
Presentation is loading. Please wait.

2
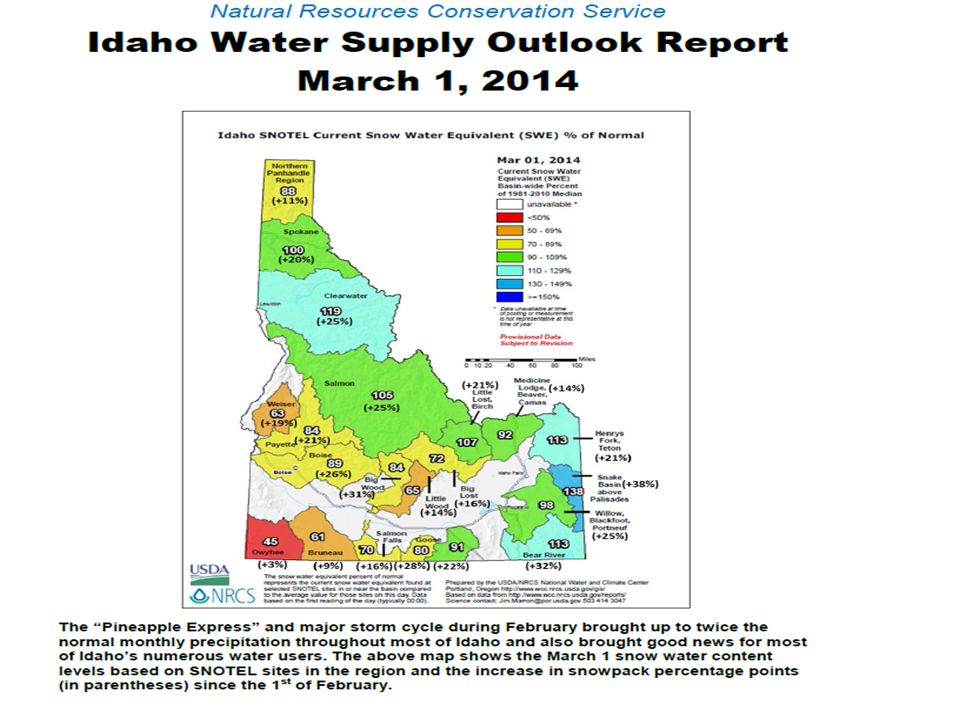
February SNOTEL Precipitation as % of Average

3
Idaho SNOTEL Precipitation March 1-14 compared to normal March Total are: 130% in Weiser 90-120% north, central, Upper Snake, Oakley, 60-75% Little Lost, Salmon Falls, Bruneau, Bear 81% Owyhee

7
February SWE Increase: Clearwater Basin - 2 nd greatest February increase since 1981; only February 1999 had a bigger increase. Boise Basin - 4 th greatest February increase since 1961; only years 1986, 1999, and 1972 received more. Snake abv Jackson Lake, Hoback, Greys, Salt, Gros Ventre – 2 nd greatest since 1961 only 1986 had more. Lewis Lake Divide – 5 th highest February increase since records start in 1919

8
As of March 13, 34.3”

12
IDAHO SURFACE WATER SUPPLY INDEX (SWSI) March 1, 2014
 March 1, 2014")
13
SNOTEL Site SQUAW FLAT – Weiser - Payette Divide 8” of precipitation since March 1

15
Camas Creek near Blaine, on average, peaks 1 day before Soldier R.S. swe reaches half melt, 6.8” peak SWE 3.4” half melt

18
Snow Indexes with March 14 SWE Data compared to April 1 Indexes: Hoback 12 th highest compared to April 1 index that starts in 1961 Greys 14 th highest compared to April 1 index that starts in 1961 Gros Venture 16 th highest compared to April 1 index that starts in 1961

23
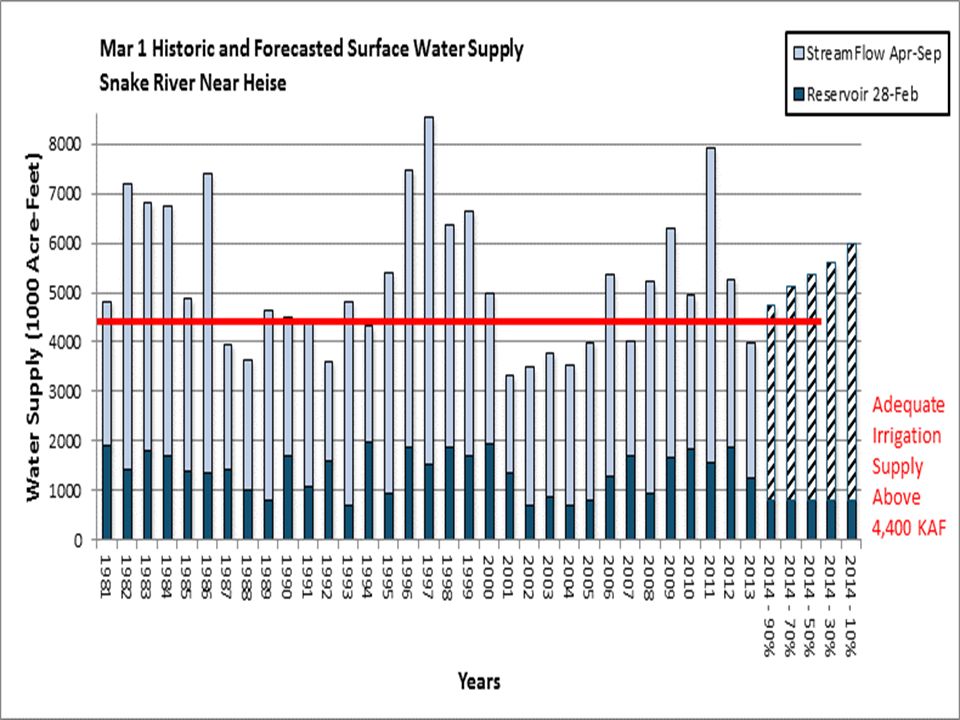
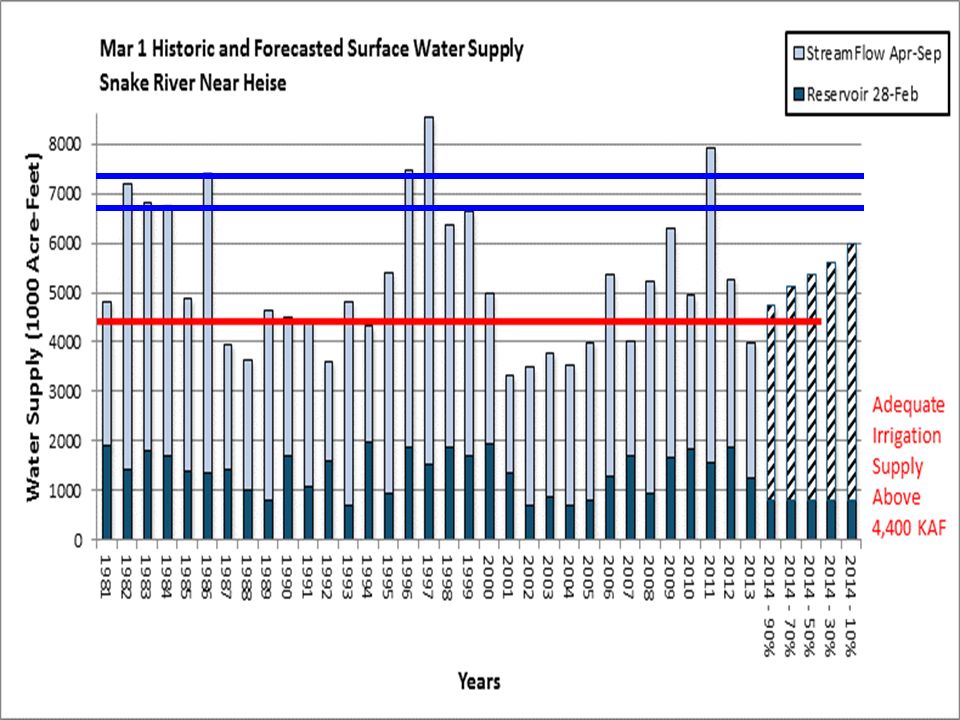
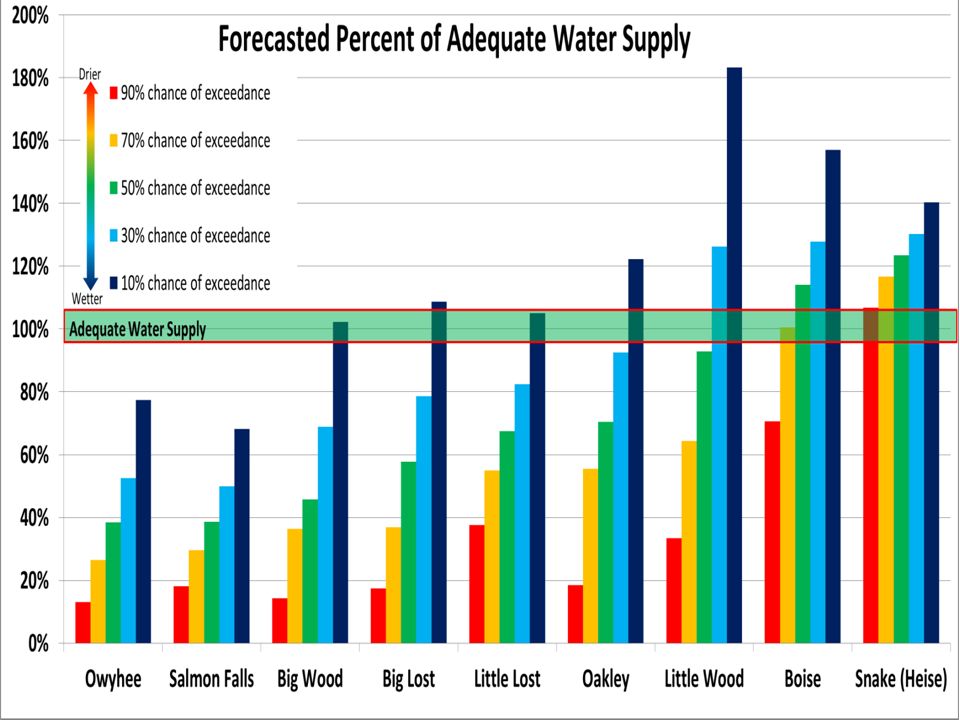
BASIN Adequate Irrigation Water Supply (KAF) Projected March 31 Reservoir Storage (KAF) Streamflow Volume Needed for Adequate Water Supply (KAF) (% of Ave.) 90% Chance of Exceedance Streamflow Forecast Apr-Sep (KAF) 70% Chance of Exceedance Streamflow Forecast Apr-Sep (KAF) 50% Chance of Exceedance Streamflow Forecast Apr-Sep (KAF) 30% Chance of Exceedance Streamflow Forecast Apr-Sep (KAF) 10% Chance of Exceedance Streamflow Forecast Apr-Sep (KAF) Salmon Falls11022 88 (103%)9 (-79)19 (-69) 28 (-60)39 (-49)58 (-30) Big Wood27550 225 (85%)0 (-225)8 (-217) 20 (-205)85 (-140)170 (-55) Oakley5023 27 (87%)9 (-18)13 (-14) 14 (-13)20 (-7)27 (0) Big Lost18031 149 (99%)27 (-122)50 (-99) 75 (-74)110 (-39)165 (+16) Little Lost400 40 (85%)13 (-27)19 (-21) 23 (-17)28 (-12)36 (-4) Owyhee45075 375 (50%)85 (-290)173 (-202) 250 (-125)340 (-35)505 (+130) Boise1500545 955 (70%)200 (-755)540 (-415) 695 (-260)850 (-105)1190 (+235) Little Wood6018 42 (45%)8 (-34)23 (-19) 36 (-6)53 (+11)83 (+41) Snake (Heise)4400700 3700 (98%)2270 (-1430)2940 (-760) 3240 (-460)3540 (-160)4210 (+510) Teton850 85 (44%)93 (+8)120 (+35) 141 (+56)163 (+78)199 (+114) Bear River400680 02 (+282)10 (+290) 62 (+342)125 (+405)217 (+497) Water Supply Outlook Key: Shortages Some Shortages Marginal Supplies Sufficient SuppliesSurplus February 1, 2014 Water Supply Forecasts, Amount Needed & Shortages Based on the 5 Exeedance Forecasts Adequate Supply Reservoir Storage = Streamflow Needed
 Projected March 31 Reservoir Storage (KAF) Streamflow Volume Needed for Adequate Water Supply (KAF) (% of Ave.) 90% Chance of Exceedance Streamflow Forecast Apr-Sep (KAF) 70% Chance of Exceedance Streamflow Forecast Apr-Sep (KAF) 50% Chance of Exceedance Streamflow Forecast Apr-Sep (KAF) 30% Chance of Exceedance Streamflow Forecast Apr-Sep (KAF) 10% Chance of Exceedance Streamflow Forecast Apr-Sep (KAF) Salmon Falls (103%)9 (-79)19 (-69) 28 (-60)39 (-49)58 (-30) Big Wood (85%)0 (-225)8 (-217) 20 (-205)85 (-140)170 (-55) Oakley (87%)9 (-18)13 (-14) 14 (-13)20 (-7)27 (0) Big Lost (99%)27 (-122)50 (-99) 75 (-74)110 (-39)165 (+16) Little Lost (85%)13 (-27)19 (-21) 23 (-17)28 (-12)36 (-4) Owyhee (50%)85 (-290)173 (-202) 250 (-125)340 (-35)505 (+130) Boise (70%)200 (-755)540 (-415) 695 (-260)850 (-105)1190 (+235) Little Wood (45%)8 (-34)23 (-19) 36 (-6)53 (+11)83 (+41) Snake (Heise) (98%)2270 (-1430)2940 (-760) 3240 (-460)3540 (-160)4210 (+510) Teton (44%)93 (+8)120 (+35) 141 (+56)163 (+78)199 (+114) Bear River (+282)10 (+290) 62 (+342)125 (+405)217 (+497) Water Supply Outlook Key: Shortages Some Shortages Marginal Supplies Sufficient SuppliesSurplus February 1, 2014 Water Supply Forecasts, Amount Needed & Shortages Based on the 5 Exeedance Forecasts Adequate Supply Reservoir Storage = Streamflow Needed")
24
March 1, 2014 Water Supply- Amount Needed, Shortages & Surplus Based on All Five Chance of Exceedance Forecasts

Similar presentations


, snotel sites (green dots) and selected photos.>")


 Current SNOTEL SWE is 70% of Average –Varies from 34 to 82% Normal –SWE about 14 inches –Meltout starts about April 15 Present.>")


