Download presentation
Presentation is loading. Please wait.

1
2015 HRS and Durum Crops Outlook
Erica Olson Marketing Specialist, NDWC

2
Summary The GOOD: The BAD: The UNKOWN: Early planting, quick harvest
Record to near-record yields Improved quality Fairly good demand The BAD: Declining price The UNKOWN: When will prices increase/decrease 2016 acreage

3
U.S. SPRING WHEAT PLANTINGS & PRODUCTION
Million Acres Million Bushels * Typically includes million bushels of white spring wheat. Source: USDA October 2015 Xldata/HRS/Acres

4
Average U.S. Wheat Yields
Bushels Per Acre Metric Tons Per Hectare HRS – Winter – All – 43.8 HRS – likely go higher with harvest reports we have heard. US all wheat record yield 2010&2012 Winter wheat yield 47.8 compared to 47.2 last year….record? HRS was 2010 – could surpass that this year Source: USDA Sept 2015

5
HRS Quality Summary Notable improvements in:
Protein – nearly two-thirds above 14% Vitreousness Falling Number DON levels High grading crop – overall #1 DNS, over 90% is a number one grade Increased milling yields Stable to slightly stronger dough properties Higher loaf volumes

6
HRS Grading & Kernel Characteristics
2014 2015 5-Year Avg. ND 2015 Test Weight (lbs/bu.) 61.4 61.6 61.9 1000 KWT (g) 32.4 31.3 31.0 Damage (%) 0.2 0.4 0.1 0.5 Total Defects 0.9 1.2 Vitreous Kernels (%) 53 83 69 81 Protein (12% moisture) 13.6 14.1 14.0 Falling Number (seconds) 339 372 383 DON 0.3
 KWT (g) Damage (%) Total Defects Vitreous Kernels (%) Protein (12% moisture) Falling Number (seconds) DON")
7
HRS: Protein Content (12% moisture basis
yr avg is 14.0

8
HRS Protein Spreads

9
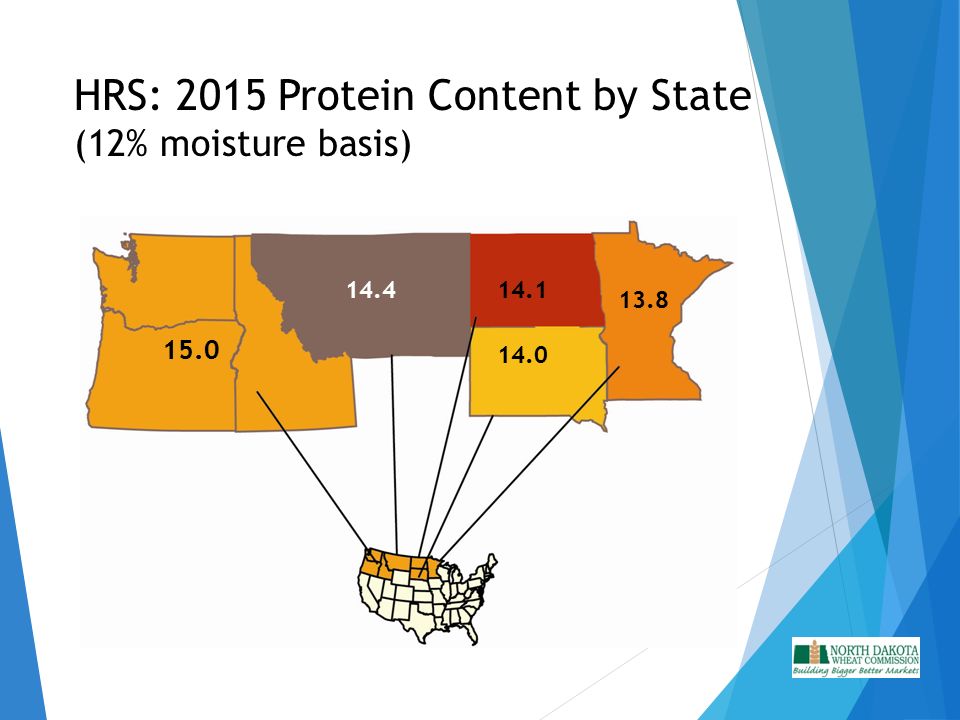
HRS: 2015 Protein Content by State (12% moisture basis)
14.4 14.1 13.8 15.0 14.0
10
HRS: Vitreous Kernel Content Distribution
2014 Avg. = 53 2015 Avg. = 83 Percent

11
HRS: Falling Number Distribution
2014 Avg. = 339 2015 Avg. = 372 Seconds

12
HRS: Flour Extraction - - - 5 yr avg is 68.5%
Test milling was conducted on a Buhler laboratory mill. Results are suitable for comparison between crop years, however yields are lower than those obtained in commercial mills. yr avg is 68.5%

13
U.S. Hard Red Spring: Dough Quality Farinograph Results
Minutes 10 11 12 13 14 15 Peak 6.2 7.5 7.4 6.0 6.7 Mix Tolerance 10.2 11.0 12.2 9.0 9.4 10.3

14
Factors affecting HRS market
Record world wheat production and supplies Good HRS production and quality Buyers not concerned about supplies Weaker overall U.S. wheat exports – HRS and durum faring better than other classes Buyers making hand to mouth purchases Competition Strong dollar No major weather concerns….yet Dry in Black Sea, up to 1/3 of crops in Russian and Ukraine considered poor condition Australia – rains prior to harvest could cause quality issues

15
WORLD WHEAT PRODUCTION
Million Tons Million Bushels Source: USDA October 2015 Xldata/world/all wheat/wheat/prod

16
WORLD WHEAT PRODUCTION – MAP (Million Bushels)
USDA October 2015 xldata/world/all/prod & use

17
WORLD WHEAT STOCKS Million Tons Million Bushels
Source: USDA October 2015 Xldata/world/all wheat/wheat/prod

18
U.S. HARD RED SPRING SUPPLY & DEMAND Million Bushels
11-12 12-13 13-14 14-15 Proj 15-16 Change Beg Stocks 185 151 165 169 212 +25% Production 398 505 491 556 564 +1% Imports 35 43 77 66 45 -32% Tot Supply 618 699 733 791 821 +4% Dom Use 225 303 318 308 287 -7% Exports 242 232 246 270 295 +9% Tot Use 467 534 579 582 End Stocks 239 +13% S/U Ratio 32% 31% 30% 37% 41% Source: USDA October 2015 Xldata/HRS/S&D

19
EXPORT PACE FOR U.S. WHEAT (Shipments and Sales as of October 29, 2015)
Million Bushels CLASS 14/15 PACE 15/16 PACE % CHANGE Hard Red Winter 181 127 -30% Soft Red Winter 105 82 -22% Hard Red Spring 175 145 -17% White 93 88 -5% Durum 12 20 +67% TOTAL 566 462 -18%

20
EXPORT PACE – U.S. HRS WHEAT (Shipment and sales as of October 29, 2015)
Million Tons Million Bushels 11/5/15

21
U.S. Dollar Index

22
U. S. FUTURES TRENDS Minneapolis – Hard Red Spring Kansas City – Hard Red Winter Chicago – Soft Red Winter – World prices $ per Bushel $ per Ton 11/4/15

23
U.S. WHEAT PRICE CHANGE AT THE PNW
$ per Ton $ per Bushel 11/4/15

24
Northern Durum Quality Summary
Notable improvements in: Vitreousness Falling Number DON levels Protein High grading crop – overall #1 HAD, majority is a #2 HAD or better Improved milling and pasta processing qualities

25
Durum Grading & Kernel Characteristics
2014 2015 5-Year Avg. ND 2015 Test Weight (lbs/bu.) 59.0 60.6 60.0 60.7 1000 KWT (g) 38.0 38.5 39.2 39.7 Damage (%) 0.8 0.3 0.6 0.4 Total Defects 1.6 1.3 1.7 Vitreous Kernels (%) 74 91 84 88 Protein (12% moisture) 13.2 13.9 13.5 13.6 Falling Number (seconds) 276 414 354 407 DON 2.1 1.2
 KWT (g) Damage (%) Total Defects Vitreous Kernels (%) Protein (12% moisture) Falling Number (seconds) DON")
26
U.S. Northern Durum: Grade Distribution

27
U.S. Northern Durum: Falling Number Distribution
2014 Avg. = 276 2015 Avg. = 414 Seconds

28
U.S. Northern Durum: Vitreous Kernel Content Distribution
2014 Avg. = 74% 2015 Avg. = 91% Percent

29
U.S. Northern Durum: 2015 Vitreous Kernels by Crop Area (percent)
97% A 87% B 89% C 96% B 95% D 89%

30
U.S. Northern Durum: 2015 DON by Crop Area (ppm)
<0.25 B <0.25 A 1.2 B 2.9 C 1.1 D 0.3

31
U.S. Northern Durum: Pasta Color Score
yr avg is 8.9 A pasta sample with a score of 8.0 or higher is considered to have good quality.

32
U.S. Northern Durum: Pasta Cooked Firmness
yr avg is 4.6 Grams CM

33
Factors affecting Durum market
World production up 10% after reaching 13-year low in 2014 Canadian crop lower than average, but better than expected EU crop is larger World stocks continue to tighten Durum susceptible to wide price swings Recovery in production and quality in U.S. crop Strong demand for U.S. durum However, overall world durum trade expected to be down this year, especially in EU and North Africa Higher domestic production, no major quality shortfalls Prices holding a premium to bread wheat, but for how long?

34
WORLD DURUM PRODUCTION – MAP (Million Bushels)
Source: Stats Canada and Int’l Grains Council Xldata/world/durum/prod October 2015

35
World Import Durum Demand
Million Tons Million Bushels

36
Durum Stocks in Major Exporting Countries – U. S
Durum Stocks in Major Exporting Countries – U.S., Canada, European Union Million Tons Million Bushels Source: Stats Canada and Int’l Grains Council Xldata/world/durum/sdmajor1 October 2015

37
U.S. DURUM WHEAT PLANTINGS BY STATE
Million Hectares Source: USDA October 2015

38
U.S. DURUM SUPPLY & DEMAND Million Bushels
10-11 11-12 12-13 13-14 14-15 Proj 15-16 Change Beg Stocks 35 25 23 22 26 +18% Production 107 50 82 58 54 +52% Imports 34 37 36 44 40 -20% Tot Supply 176 122 143 125 126 148 +17% Dom Use 98 70 91 73 63 78 +24% Exports 43 27 29 31 +8% Tot Use 141 97 120 103 100 118 End Stocks 30 +15% S/U Ratio 25% 27% 19% 21% 26% Source: USDA October 2015 Xldata/durum/S&D

39
EXPORT PACE – U.S. DURUM WHEAT 2015-16 as of October 29, 2015
Million Bushels Million Tons 11/5/15

40
Average N.D. Hard Red Spring and Durum Wheat Producer Bids
$ per Bushel $ per Ton 10/9/15

41
Average N.D. Durum Wheat Prices
$ per Bushel $ per Ton 10/31/15

42
QUESTIONS??

Similar presentations


