Download presentation
Presentation is loading. Please wait.

1
Race and Ethnic Disparities in Adverse Birth Outcomes in the United States: an Overview James W. Collins, Jr. 11/7/15

2
INFANT MORTALITY RATES 1. Hong Kong 1.8 16. Germany 3.9 2 Sweden 2.5 17. Switzerland 4.0 3. Japan 2.6 18. Denmark 4.0 4. Finland 2.6 19. Belgium 4.0 5. Norway 2.7 20. Australia 4.1 6. Greece 2.7 21. Croatia 4.5 7. Czech Republic 2.8 22. Cuba 4.7 8. Portugal 3.3 23. United Kingdom 4.8 9. Korea 3.4 24. New Zealand 5.0 10. Spain 3.6 25. Canada 5.1 11. Italy 3.6 26. United States-Whites 5.6 12. France 3.6 26. Hungary 5.6 13. Austria 3.7 27. Poland 6.0 14. Israel 3.8 28. Malaysia 6.4 15. Netherlands 3.8 29. United States 6.6

3
INFANT MORTALITY RATES IN THE U.S.

4
INFANT MORTALITY RATES IN NEVEDA

5
Cause-Specific Infant Death Rates: United States Causes of Infant Death WhiteAfrican- American RR Congenital malformations 1.41.61.2 Disorders related to short gestation 0.82.93.9 SIDS0.51.22.4 Pregnancy complications 0.30.83.1 Complications of placenta, cord, membranes 0.20.42.0

6
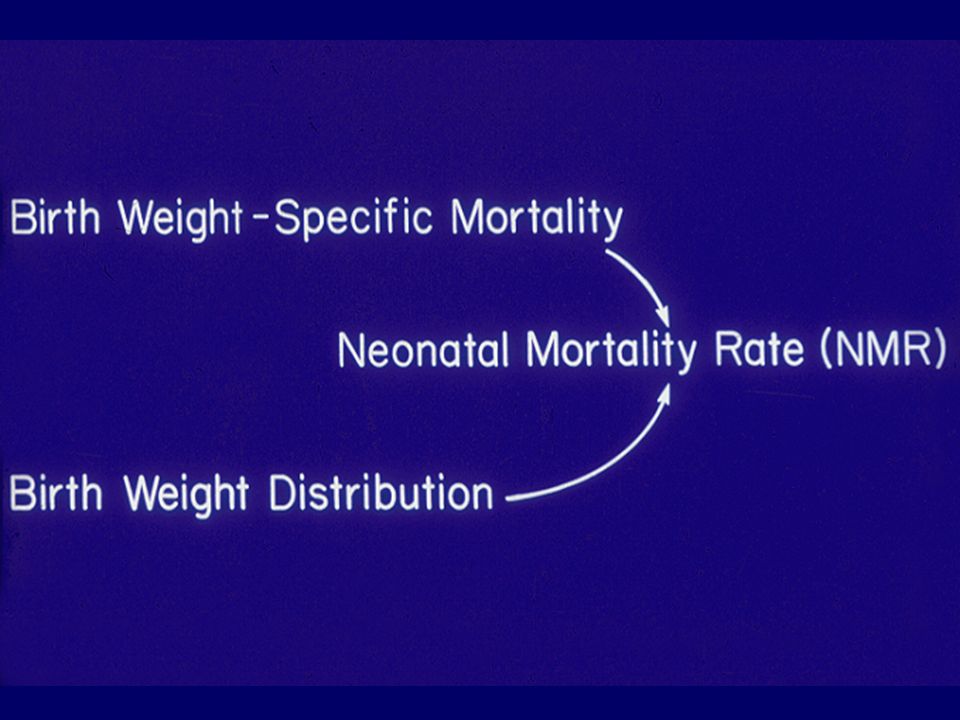
NEONATAL MORTALITY RATES

8
LBW (< 2500g) infants account for 7.9% of births and 66% of deaths. Approximately two-thirds are preterm (<37 wks). VLBW (< 1500g) infants account for 1.5% of births and 50% of deaths. Nearly 100% are preterm.
. VLBW (< 1500g) infants account for 1.5% of births and 50% of deaths. Nearly 100% are preterm..")
9
16% of VLBW infants are moderately or severely handicapped

10
FETAL ORIGINS OF ADULT DISEASE Poor fetal growth and small size at birth are associated with an increased risk of coronary heart disease, stroke, hypertension, Type 2 diabetes, the metabolic syndrome, and osteoporosis in adulthood. Gluckman et al, NEJM, 2008.

11
Seven Decade Trend in Low Birth Weight Rates in the United States

12
Seven Decade Trend in Very Low Birth Weight Rates in the United States

13
LBW Rates by Maternal Age in African-American and White Mothers, Cook County, IL, Love et al, AJE, 2010

14
PTB Rates by Maternal Age in African-American and White Mothers, Cook County, IL, Love et al, AJE, 2010

15
Preterm Birth Rates by Maternal Education and Race (Braveman et al, AJPH, 2015)
")
16
RACIAL GAP IN PERINATAL OUTCOME AMONG INFANTS CONCEIVED BY ART (Schieve et al, Obstet Gynecol, 2004)
")
17
LBW RATES AMONG LATINOS IN CHICAGO

18
LBW RATES OF MEXICAN-AMERICANS BY MATERNAL GENERATIONAL RESIDENCE IN THE U.S. Collins and David, Ethn Dis, 2004)
.")
19
VLBW RATES OF MEXICAN-AMERICANS BY MATERNAL GENERATIONAL RESIDENCE IN THE U.S. Collins and David, Ethn Dis, 2004)
.")
20
White Life-long Minority Status Puberty Pregnancy 05ys The Racial Gap in Reproductive Potential: A Life-Course Perspective Lu and Halfon,MCHJ, 2003 Reproductive Potential Risk Factors Life Course Protective Factors

21
Neighborhood Poverty

22
Lifetime Neighborhood Experience in Chicago: White and Black White WomenAfrican American Women 0.2% 15% 29% 0.6% 16%

23
“for the last few days whole lots of things been going on like shooting, killing, dying, death. That happens every day, every week, any month. Like they tried to kill my cousin, my uncle almost tried to hurt my grandfather to take his money. Everywhere you go you see people on streets, in abandoned buildings, on the corners, breaking in houses, getting stopped by police. Every day the same things happen.” Composition written by 6th-grade pupil from Robert Taylor Homes, Chicago Photo from United Nations Building Exhibit, 4/06

24
RACE-SPECIFIC LBW RATES BY LIFELONG RESIDENTIAL ENVIRONMENT (Collins et al, MCHJ, 2009)
")
25
Population Attributable Risk % of Adverse Birth Outcome for Lifelong Residence in Low-Income Neighborhoods

26
Young and advanced maternal age are known risk factors for infant low birth weight (<2500g, LBW) among Whites. A limited literature shows that the risk of infant LBW for African-American women grows monotonically with advancing age. Geronimus termed the deterioration in reproductive health status over the childbearing years among African-American women as “weathering” (Ethn Dis, 1992).
..")
27
RESEARCH QUESTION To what extent does neighborhood poverty modify the risk of low birth weight (< 2500g, LBW) associated with advancing age among urban African-American women?
 associated with advancing age among urban African-American women")
28
Ecologic Risk Factor (ERF): median family income 19%, homicide rate > 1.3/1,000, lead poisoning rate >2.8/1,000. Neighborhoods with four ERF were empirically defined as extremely impoverished. Neighborhoods with zero ERF were defined as non-impoverished. Neighborhood Poverty and Weathering

29
DISTRIBUTION OF AA WOMEN’S (N=104,676) EXPOSURE TO ERF
 EXPOSURE TO ERF")
30
LBW RATES BY MATERNAL AGE AND NEIGHBORHOOD POVERTY: African-Americans (Collins et al, Ethn Dis, 2006 )
")
31
LBW RATES BY MATERNAL AGE AND NEIGHBORHOOD POVERTY (PRIMAGRAVIDS)
")
32
LBW Rates by Maternal Age in African-American Mothers Experiencing Lower-lower versus Upper-upper Neighborhood Economic Context, Cook County, IL, 1989-1991 Love et al, AJE, 2010 ; Love et al, AJE, 2010

33
SGA Rates by Maternal Age in African-American Mothers Experiencing Lower-lower versus Upper-upper Neighborhood Economic Context, Cook County, IL, 1989-1991 Love et al, AJE, 2010

34
PTB Rates by Maternal Age in African-American Mothers Experiencing Lower-lower versus Upper-upper Neighborhood Economic Context, Cook County, IL, 1989-1991 Love et al, AJE, 2010

35
AA Mothers born from 1956-1976: Where did they live when they had babies (89-91) 1956-1976 Poor Neighborhoods (48%) 20,306 11,265 (55%) Poor in 89-91 8,808 (39%) Medium in 89-91 743 (4%) Affluent in 89-91
 Poor Neighborhoods (48%) 20,306 11,265 (55%) Poor in ,808 (39%) Medium in (4%) Affluent in 89-91")
36
Upward Economic Mobility and PTB among AA in Cook County, IL, Collins et al AJPH, 2011

37
Stratum-specific ORs (95% CIs) for the Relationship between Maternal Upward Economic Mobility and PTB by Age
 for the Relationship between Maternal Upward Economic Mobility and PTB by Age")
38
AA Mothers Upward Economic Mobility from Early-Life Impoverishment and PTB by Education

39
AA Mothers Upward Economic Mobility from Early-Life Impoverishment and PTB by Prenatal Care

40
Upward Economic Mobility from Early-Life Impoverishment is Associated with Lower PTB only Among former non-LBW Mothers (Collins et al AJPH, 2011)
")
42
Background Fetal programming acts at the level of DNA, in a phenomenon called epigenetics. Researchers have used low birth weight (< 2500g, LBW) as the major marker of aberrant fetal programming. Aspects of mother’s social environment may subject her to influences during fetal life that results in her slowed growth in utero and also programs her to have preterm infants as an adult.
 as the major marker of aberrant fetal programming. Aspects of mother’s social environment may subject her to influences during fetal life that results in her slowed growth in utero and also programs her to have preterm infants as an adult..")
43
Multilevel Logistic Models Among Former LBW and non-LBW Impoverished-born AA Mothers Low Upward Economic Mobility Modest Upward Economic Mobility High Upward Economic Mobility Adjusted OR of PTB among former non-LBW, 20-35 yo mothers 0.8 (0.7-0.9) 0.6 (0.4-0.7) Adjusted OR of PTB among former LBW mothers, 20-35 yo mothers 0.9 (0.5-1.6)1.1 (0.4-2.8)1.3 (0.3-4.7)
 0.6 ( ) Adjusted OR of PTB among former LBW mothers, yo mothers 0.9 ( )1.1 ( )1.3 ( )")
44
AA Mothers (N=4,840) Upward Economic Mobility from Early-Life Modest (2 nd Quartile) Impoverishment There was a significant interaction between birth weight and upward mobility among mothers aged 20-35 years (p=0.003). The crude and adjusted ORs of PTB among former LBW mothers who experienced upward economic mobility were greater than one (with the 95% CI including the null value). The crude and adjusted OR of PTB among former non- LBW mothers who experienced modest and high upward economic mobility equaled 0.7 (0.6-0.9) and 0.8 (0.7-1.0), respectively.
. The crude and adjusted OR of PTB among former non- LBW mothers who experienced modest and high upward economic mobility equaled 0.7 ( ) and 0.8 ( ), respectively..")
45
White Mothers born from 1956-1976: Where did they live when they had babies (89-91)? 1956-1976 Affluent Neighborhoods (40%) 12,758 4,891 (38%) Affluent in 89-91 7,532 (59%) Medium in 89-91 335 (3%) Poor in 89-91 Illinois Transgenerational Birth-File; David et al, MCHJ, 2010
 12,758 4,891 (38%) Affluent in ,532 (59%) Medium in (3%) Poor in Illinois Transgenerational Birth-File; David et al, MCHJ,")
46
Upper-Class Born White Women’s Downward Economic Mobility and IMR in Cook County, IL (Collins et al, MCHJ, 2015)
")
47
Downward Economic Mobility and PTB among Whites in Cook County, IL (Collins et al, MCHJ, 2015)
")
48
Former LBW and non-LBW Upper-Class Born White Women’s Downward Economic Mobility and PTB Rates (Collins et al, MCHJ, 2015)
")
49
White Mothers Downward Economic Mobility from Early- Life Affluence and PTB by Education (Collins et al, MCHJ, 2015)
")
50
Layers of Inequality: Power, Policy, and Health David and Collins, AJPH, 2014 Understanding the high rates of White infant mortality in the U.S. requires an analysis of inequity based on class. Understanding the African-American women’s pregnancy disadvantage requires an analysis of the effects of race as a social construct, thus addressing discrimination and racism in its various forms.

51
Race “Race” is not a biological construct that reflects innate differences, but a social construct that precisely captures the impacts of racism. (Jones, AJPH, 2000)
.")
52
Racism

53
MATERNAL LIFETIME EXPOSURE TO INTERPERSONAL RACISM AND BIRTH OUTCOME (Collins et al, AJPH, 2004)
")
54
MATERNAL LIFETIME EXPOSURE TO INTERPERSONAL RACISM IN 1 OR MORE DOMAINS AND INFANT BIRTH WEIGHT (Collins et al, AJPH, 2004)
")
55
MATERNAL LIFETIME EXPOSURE TO INTERPERSONAL RACISM IN 3 OR MORE DOMAINS AND BIRTH OUTCOME (Collins et al, AJPH, 2004)
")
56
MATERNAL CHRONIC EXPOSURE TO INTERPERSONAL RACISM IN THE WORKPLACE AND PTB OR=2.3 (0.8-6.1)“ You are watched more closely than others because of your race”. OR=2.3 (0.8-6.1) OR=2.3 (1.0-5.1)“Whites often assume that you work in a lower class job than you do and treat you as such”. OR=2.3 (1.0-5.1) OR=2.0 (0.8-4.3)“You are treated with less dignity and respect than you would be if you were white”. OR=2.0 (0.8-4.3)
 OR=2.3 ( ) Whites often assume that you work in a lower class job than you do and treat you as such . OR=2.3 ( ) OR=2.0 ( ) You are treated with less dignity and respect than you would be if you were white . OR=2.0 ( ).")
57
MATERNAL CHRONIC EXPOSURE TO INTERPERSONAL RACISM IN THE WORKPLACE AND BIRTH OUTCOME (Collins et al, AJPH, 2004)
")
58
Self-Reported Experiences of Racial Discrimination and the Racial Disparity in Preterm Delivery: the CARDIA Study (Mustillo et al, AJPH, 2004)
")
59
Racial Discrimination and the Racial Disparity in Low Birth Weight Delivery: the CARDIA Study (Mustillo et al, AJPH, 2004) 4.2 (1.3-13.7).Unadjusted OR of LBW delivery for African- American (compared to White) women was 4.2 (1.3-13.7). 2.1 (0.8-5.9).Adjusted (racial discrimination) OR of LBW delivery was 2.1 (0.8-5.9). 2.4 (0.8- 7.4.Adjusted (racism, SES, depression, alcohol, and tobacco use) OR of LBW delivery was 2.4 (0.8- 7.4.
.Adjusted (racial discrimination) OR of LBW delivery was 2.1 ( ). 2.4 ( Adjusted (racism, SES, depression, alcohol, and tobacco use) OR of LBW delivery was 2.4 (")
60
Methods: Perceived Racism Scale 60 Emotional Responses to Racism in Public Setting How _____ do you generally feel? –angry –frustrated –sad –powerless –hopeless –ashamed –strengthened Angry Depressive Strengthened

61
Stratum-specific ORs (95% CIs) for Relationship between Frequency of Experiences of Racism and Preterm Birth by Depressive Emotional Response (Rankin et al, Ethn Dis, 2010) 61
 for Relationship between Frequency of Experiences of Racism and Preterm Birth by Depressive Emotional Response (Rankin et al, Ethn Dis, 2010) 61")
62
Differences in the Self-Reported Racism Experiences of US-born and Foreign-born Black Pregnant Women (Parker-Dominguez, SSM, 2009) Explored self-reports of racism recorded in a survey of 185 US-born and 114 foreign-born Black pregnant women enrolled in a prospective cohort study of pregnant women in Boston, MA. Self-reported prevalence of personal racism and group racism was significantly higher among US-born than foreign-born Black pregnant women.

63
Fathers

64
Background Maternal and child health research has routinely investigated the social determinants of birth outcome as measured by women’s characteristics. The socioeconomic and cultural landscape of African-American fatherhood suggests that the role of paternal socioeconomic position (SEP) may be particularly salient to the racial disparity in birth outcome. -- college graduation rates -- unemployment rates -- incarceration rates
 may be particularly salient to the racial disparity in birth outcome. -- college graduation rates -- unemployment rates -- incarceration rates.")
65
Paternal SEP and LBW rates: Preliminary Data

66
AA Fathers Lifelong SEP and LBW Rates by Maternal Education (Prelim Data, APHA, 2014)*
*")
67
AA Fathers Lifelong SEP and LBW Rates by Marital Status (Prelim Data, APHA, 2014)*
*")
69
Allostasis McEwen 1998

70
Allostasis McEwen 1998

71
Stress and Allostastic Load McEwen 1998

72
Adverse Environmental conditions Social policy Poverty Racism Limited Access to Care Under- Education Job Strain Lack of access to good Nutrition Weathering Stress Lower Class Status Poor Working Conditions Bad Housing Bad Neighborhoods Unemployment Paternal Low SEP Preterm Birth Adapted from A. R. James

73
Improving Pregnancy & Birth Outcomes Go Ecological Begin to address the social and economic inequities that are the root cause of health disparities

74
All of this will not be finished in the first 100 days. Nor will it be finished in the first 1,000 days, not in the life of your Administration, nor even perhaps in our lifetime on this planet. But let us begin. John F Kennedy (1961)
.")
75
Let America be America again. Let it be the dream it used to be…. O, let America be America again– The land that never has been yet– And yet must be— the land where every man is free. Langston Hughes

Similar presentations


 are more prone to –Die early in life –Have health problems.>")
 are more prone to – Die early in life – Have health problems later in life – Educational.>")
 and Women’s Health during Pregnancy Findings from the 2004-2008 Rhode Island PRAMS Hanna Kim, Samara Viner-Brown, Rachel.>")
 Childhood poverty is a major problem in the US –Over 22% of children in the US live in poverty as compared to 9% in.>")


 Networking Forum May 15,>")


